When was the last time you saw a headline that said something like, “Everything is fine. There is no need to change your portfolio”? This headline wouldn’t generate many site visits.
So, in our pay-per-click world, these articles aren’t published. Instead, depending upon when you opened the paper during the last year, either the next recession was imminent and cash was the only safe investment, or everything was fantastic and anything less than 100% shares was an underweight. In short, investors have been conditioned to expect extreme views. These opinions are not necessarily wrong, but they are perhaps a little inflammatory. Often, ‘doing something’ following a bout of market volatility can be a good way to reduce wealth. As has been attributed to Warren Buffett, “The stock market has a very efficient way of transferring wealth from the impatient to the patient.”
Let’s take a deep breath and ask whether the ‘turmoil’ of the last year has been out of the ordinary.
Is the recent experience normal?
Consider the daily returns for the Australian share market based on the All Ords Accumulation Index. As shown in Chart 1, starting with the current rolling 12-month return to early April 2016 (-9.8%, the orange bar), since 1980 the Australian share market has delivered annual returns between approximately -50% (November 2008, the most precipitous part of the GFC) and +100% (September 1987, the month prior to The Crash of ‘87). History shows that rolling 12-month returns have been worse than the last year just over 11% of the time since 1980. The recent past hasn’t been a great time for investors, but neither is it particularly rare.
Chart 1: Rolling 12-month returns since 1980 for All Ordinaries Accumulation Index
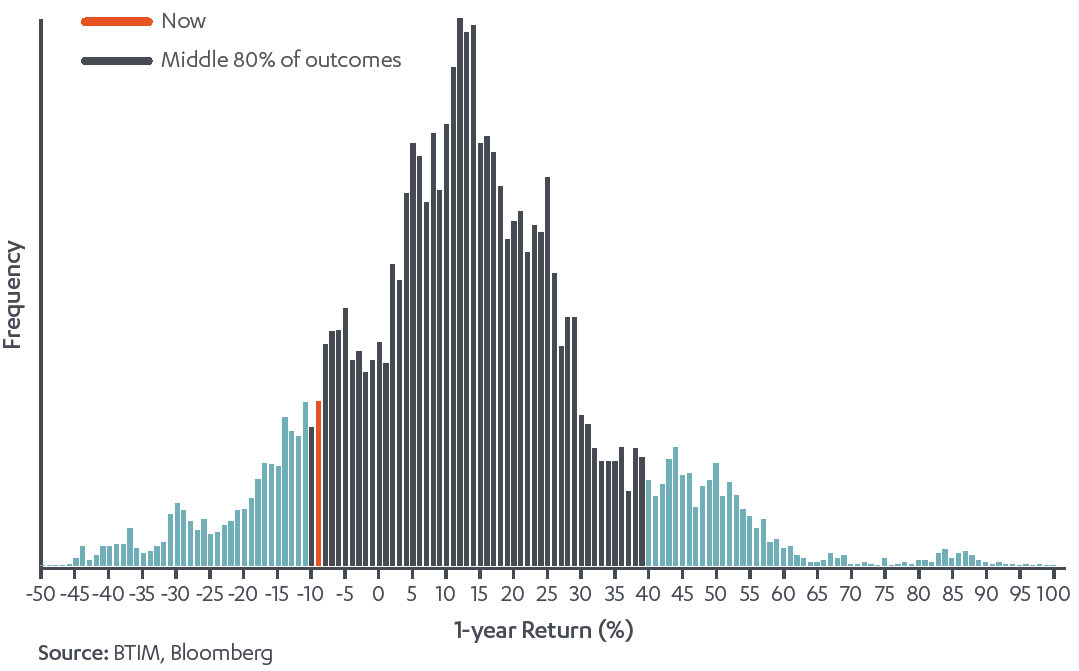
Note: Frequency numbers sum to 100%
Now let’s look at risk: the ‘risk’ (which we define as standard deviation of returns, or volatility) in the past year to early April 2016 was 17.5% p.a. Since 1980 the range has been between 6% and 36% and, similar to the return chart above, about 12% of observations have been worse than experienced in the past year. Again, this is towards the poor end of ‘normal’ outcomes, but not particularly unusual. Chart 2 suggests volatility occurs in two states: less than 20% (the typical situation) or more than 20% (the extreme situation), which can be seen from the relatively high frequency of high volatility outcomes on the right side of the chart.
Chart 2: Annualised standard deviation of returns since 1980 for All Ordinaries Accumulation Index
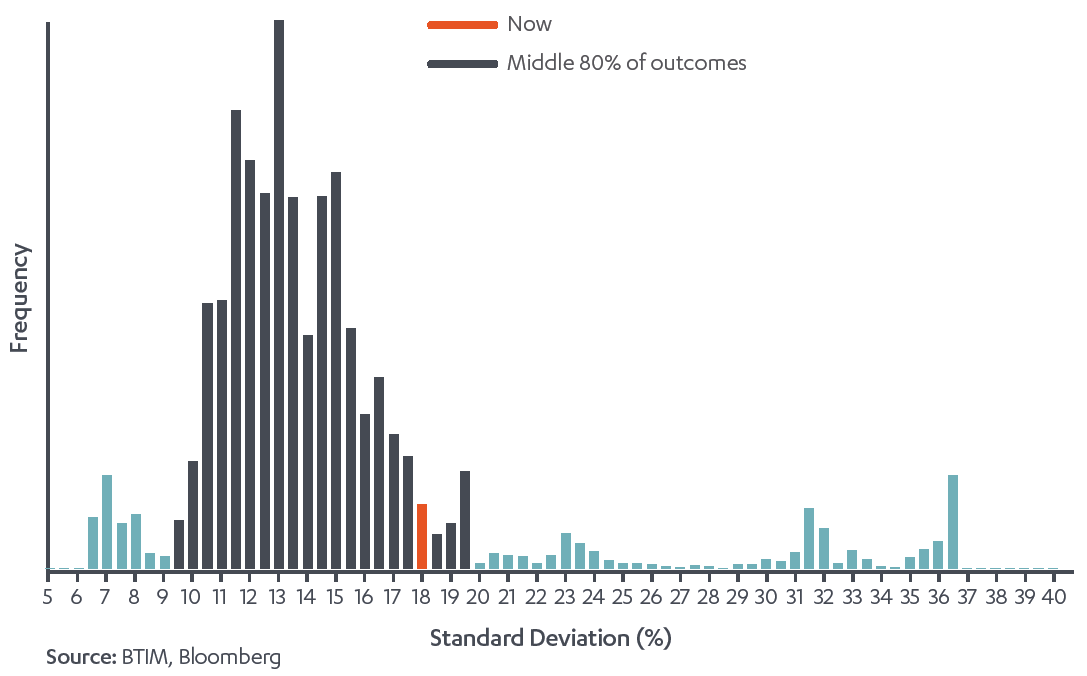
Frequency numbers sum to 100%
Can volatility predict return?
We can look at the relationship between historical volatility and future returns to determine whether we can use volatility to predict market direction. This table is a comparison of the realised volatility of any single year and the return in the following year (calculated for every day rather than at the end of the month or year).
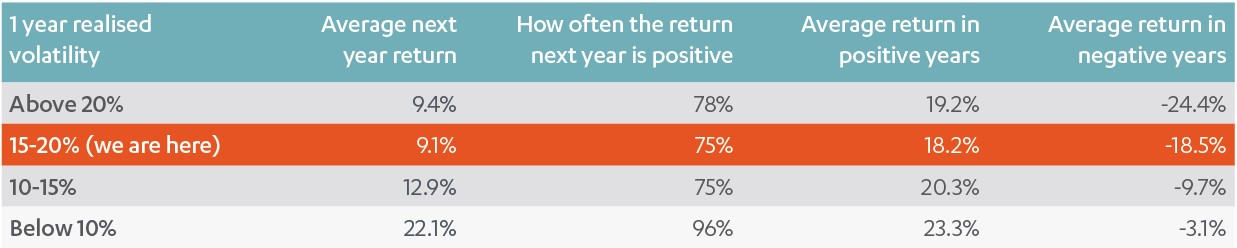
On this analysis, volatility has no reliable predictive power for future returns, but some general tendencies can be seen:
- Regardless of the level of volatility (column 1), future returns were positive at least 75% of the time (column 3)
- Positive years were best (column 4) when preceded by lower volatility
- Negative years were worst (column 5) when preceded by higher volatility.
This tendency suggests more caution when recent volatility has been higher, but hardly screams that it’s time to throw in the towel. When realised volatility has been between 15% and 20%, returns in the following year still tend to be positive three times as often as they are negative. Pretty good odds! The point is that we just can’t reliably use risk to predict return.
But what about the very long term?
We will now switch to a much longer data series, nearly 150 years of S&P 500 Index returns courtesy of Professor Robert Shiller’s website. This data, in Chart 3, encompasses a huge range of economic environments. Looking at returns shows investing in shares can be a roller coaster ride. The range of rolling 12-month returns is between -67% and +165%, with 80% of these observations falling between -12% and +34%. Interestingly, the so-called Tech Bubble of the late 1990s doesn’t stand out as anything out of the ordinary when seen in such a long history.
Chart 3: S&P 500 Index rolling 12-month total returns since 1871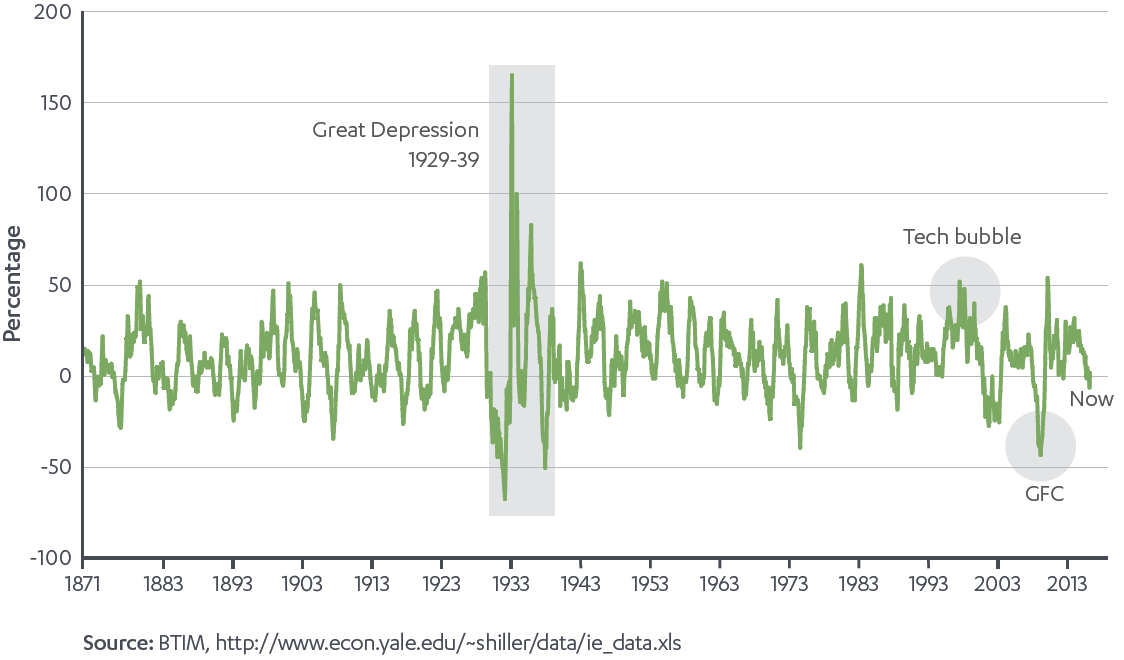
Now look at the 3, 5, 10 and 20-year rolling returns in Chart 4. It’s clear that the longer the investment horizon, the more predictable the outcome and therefore the greater the surety of achieving wealth creation objectives.
Chart 4: S&P 500 Index total returns since 1871 for different rolling periods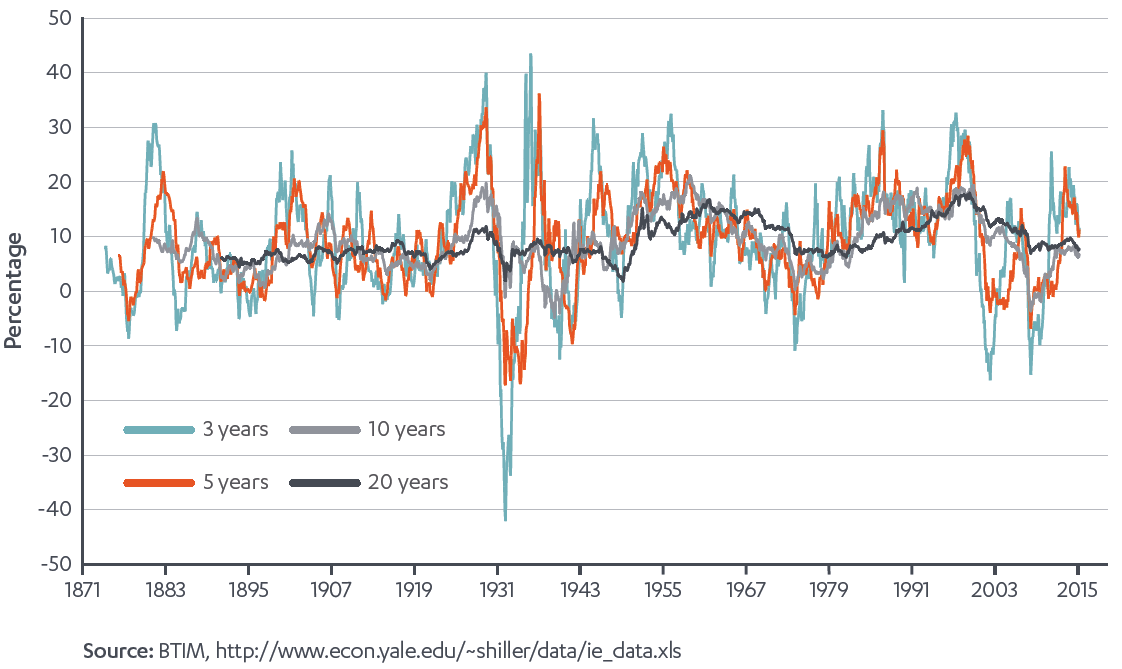
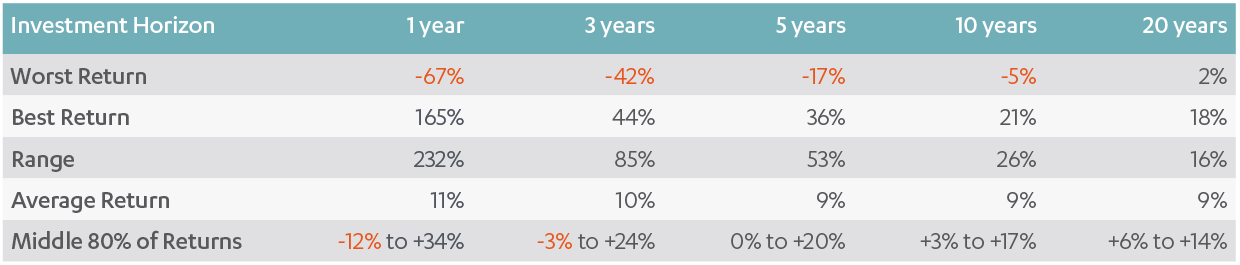
Three-year returns still have a wide range of outcomes but are materially better than 1-year, and 5-year returns are starting to become a little more palatable. By ‘better’, we mean more consistent. Aside from the Great Depression, the occasions where the S&P 500 Index delivered a negative 5-year return were few and brief. By the time we get out to a 20-year holding period, the S&P 500 Index has never had a negative total return. While this sounds like a really long time, it’s actually the investment horizon of an investor in their mid-forties.
Essentially, in the above two S&P 500 Index charts, the green line of 1-year returns is what you experience but the black line is what you could get. The key here is that asset classes need to be given long enough to let the short-term noise wash out and for the long-term risk premium to pay off. The longer an investor can stick to the plan, the better. What’s more, it’s easy to do!
Rules by which to invest
While it’s tempting within a diversified portfolio to sell down equities ‘if they look toppy’ or buy ‘if they are cheap’, that’s speculation, not investing. It’s our firm belief that the strategic asset allocation needs to be set with reference to, and maintained for, a period consistent with the investment horizon of the investor. Material changes should really only be made when there is a change in the circumstances of the investor and the temptation to ‘just do something’ should be resisted. A well-diversified, appropriately positioned portfolio is likely to do the job required of it as long as it is given enough time. Develop an appropriate investment plan and stick to it.
In particular, make use of two powerful tools available to investors:
- Sometimes referred to as ‘the only free lunch in investing’, appropriate use of diversification improves the surety of investment outcomes.
- You are saving for your retirement and the investment horizon should match. Recent market returns make for entertaining table talk, but it’s the long term average outcome that determines one’s quality of life in retirement. Asset allocations should be set for the long-run balance between risk and return rather than trying to predict what’s going to happen in the next few months.
One of the fundamental tenets of asset allocation should be: MORE TIME = MORE SURETY
Be the patient investor and let the market transfer money from the impatient to you.
Stuart Eliot is Portfolio Manager at BT Investment Management. See more details on BTIM’s Diversified Funds here. This information is for general information only and has been prepared without taking into account any recipient’s personal objectives, financial situation or needs.