Register For Our Mailing List

Register to receive our free weekly newsletter including editorials.

Home / 165

Lessons from recent results of CalPERS, Buffett and super funds

The largest Australian and global asset managers are reporting their results for last year, and they are useful benchmarks for all retail and institutional investors. While everyone has different goals and strategies, there is some reassurance for the novice investor that even the most sophisticated managers are struggling in the current market.

This article looks at the results from CalPERS released this week, Warren Buffett’s Berkshire Hathaway in 2015, and Australia’s superannuation funds in the past financial year.

California Public Employees’ Retirement System (CalPERS)

CalPERS is the largest defined-benefit public pension scheme in the United States, managing over US$300 billion on behalf of millions of Californian school and public service members.

This week it reported an annual return of 0.61% net of fees for the year to 30 June 2016. Far from being embarrassed about the result, Chief Investment Officer Ted Eliopoulos said, “Positive performance in a year of turbulent financial markets is an accomplishment we are proud of.”

CalPERS splits its performance into asset classes as shown in Table 1.

Table 1: Asset class performance by CalPERS in year to 30 June 2016

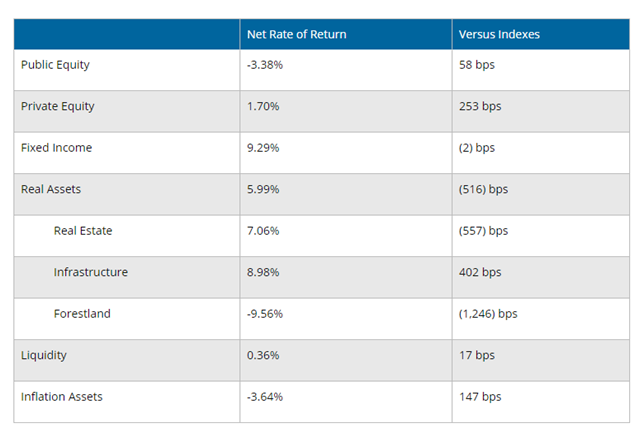
Returns are heavily dependent on the performance of listed companies, since half their portfolio is in equities, but they point to the merit of diversification. The poor equity result was offset by strong fixed income, real estate and infrastructure returns, largely driven by declining interest rates. Unfortunately, these rate gains will be difficult to repeat.

As expected from such a massive fund, its processes are supported by a detailed Asset Liability Management system, described here. It covers asset allocation, demographic change, actuarial assumptions and estimates of the overall soundness of their defined-benefit plans. The assumptions were last reviewed in 2014. This might explain why they continue to assume strong rates of return, as shown by their statement on common misconceptions:

Myth: CalPERS 7.5% assumed annual rate of investment return is too high and cannot be achieved: CalPERS investments have earned an average 7.6% annual return over the past 20 years and 9.4% over the past 30 years. CalPERS investments earned 13.2% in Fiscal Year 2012-13. CalPERS assumed rate of investment return is a long-term [20 years or more] average. Any given year is likely to be higher or lower than the assumed rate.”

Not only are they quoting returns from another world in 2012/2013, but their more recent commentary talks about the current challenging conditions. Eliopoulos will struggle to explain in his next review of assumptions how he can average 7.5% in the coming decade.

Berkshire Hathaway

Warren Buffett’s annual letter to shareholders contains the usual gems, and he dispels the negative ‘drumbeat’ about his country’s problems:

“The babies born in America today are the luckiest crop in history ... For 240 years it’s been a terrible mistake to bet against America, and now is no time to start. America’s golden goose of commerce and innovation will continue to lay more and larger eggs. America’s social security promises will be honoured and perhaps made more generous. And, yes, America’s kids will live far better than their parents did.”

(As an aside, the millions of babies and kids whose parents earn the minimum wage of US$7.25 an hour will struggle to appreciate how lucky they are unless someone funds their college education).

Buffett reports his performance in many ways, including per-share book value (up 6.4% in 2015 versus a long-term average since 1965 of 19.2% pa) and per-share market value (down 12.5% in 2015 versus up 20.8% pa since 1965). He discusses intrinsic value at length, including earnings from Berkshire’s businesses increasing by 2.1% in 2015 versus 23.7% pa since 1970. In 2015, the S&P500 rose by only 1.4% including dividends.

So while Buffett continues to demonstrate outstanding investment acumen and long-term optimism, the recent performance is a far cry from historical levels, any way the results are measured. There are many reasons for this, not least the fact that his company is now valued at about US$330 billion. Small investments do not move the needle.

Obviously his short-term performance is affected by market forces, but he considers the major risks for his companies are:

  • The railroad business is certain to lose significant coal volume over the next decade.
  • At some point in the future, his insurance and auto dealership companies may shrink because of driverless cars.
  • Circulation of his print newspapers will continue to fall.
  • Renewables have previously helped his utility operations but this could change, particularly if storage capabilities for electricity materially improve.
  • Online retailing threatens the business model of his retailers and certain consumer brands.

But he is not concerned about year-to-year vagaries of the stock exchange:

“These potentialities are just a few of the negative possibilities facing us – but even the most casual follower of business news has long been aware of them. None of these problems, however, is crucial to Berkshire’s long-term well-being.”

If only all company executives and investors could think with such a long-term horizon.

Australian superannuation industry funds

The median industry superannuation fund returned 3% in the year to 30 June 2016, the lowest annual level in four years, according to superannuation researcher Chant West. The median returned 6.2% pa over the past 15 years. These numbers apply for the Growth category (see Table 2 below) used by the majority of Australians, where 61% to 80% of investments are allocated to 'growth' assets.

Table 2: Diversified fund performance (results to 30 June 2016)

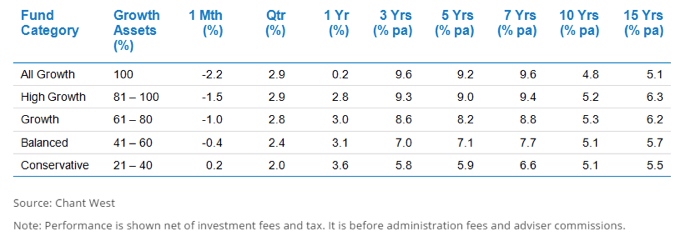
Warren Chant described the benefits of diversification enjoyed by the best performers (the top fund was up 7.6%), as Australian equities returned less than 1%. Strong returns came from listed property (up 24.6%), unlisted infrastructure (up 17.9%), global fixed interest (up 9.3%) and domestic fixed interest (up 7%).

“While this year’s return is significantly lower than the previous three years (15.6% in 2012/13, 12.8% in 2013/14 and 9.8% in 2014/15), members shouldn't be too disappointed with the result given that super funds are faced with a very uncertain global political and economic environment. They’ve had a particularly good run since the end of the GFC.”

The major lessons from experienced investors

Three messages from professional investors are: think long term, accept lower returns in the current market, and diversify exposure.

The biggest challenge facing all investors, and especially the less-experienced, is to focus on a long-term strategy and not blink every time the market has a correction. Buffett has such faith in the long-term robustness of his businesses that he sees market falls as buying opportunities (during the GFC, he bought options expiring in 2021 with the right to acquire 700 million Bank of America shares for US$5 billion which are now worth US$12 billion). CalPERS may be optimistic in expecting a 7.6% return in coming years but they remain unfazed by a poor year.

Where Australian industry super funds have gained an edge is holding a decent allocation, around 20%, in unlisted assets such as private equity, infrastructure and property. These ‘alternative’ assets are available to most retail investors, either through unlisted syndicates, listed investment companies, exchange traded funds or managed funds.

Notwithstanding the benefits of diversification supported by recent experience, it is difficult to see the strong performance of fixed interest being repeated in coming years, and it could be negative as rates rise. Equities are fully valued and property has had a stellar run. While 'lower for longer' has become the common cliche, the last year has shown there are market opportunities for those who are canny at asset allocation.


Graham Hand is Editor of Cuffelinks. This article is general information and does not consider the needs of any individual.    


9 Comments
kevin
July 23, 2016

I should also add an index that can be created.The all ords went from 6800 down to 3100.CBA from 6200 down to 2700.

At present the all ords is around 5500,CBA is around 7700.Perhaps a fairer index would be on the way up they were both at approx. 3900 (CBA being $39 a share).Shall we say 4000.I'm sure you can find a chart the verifies this as my memory of that date is vague.If we assume the date to be 1/7/2010 then it is easy to chart them for the rest of your life.

Is diversification better ,or is concentration of risk better.As always time will tell.

Graeme
July 21, 2016

Not meaning to offend those above, but I suspect how a few individuals have performed is largely irrelevant. Human nature what it is, only those who have done well are going to disclose on a forum such as this. No one 'advertises' poor results.

kevin
July 23, 2016

I would disagree with that.I do my own thinking.During the GFC I watched CBA go from $62 down to around $27.No need to panic,market sentiment does that.Never did I dream that 6 months after feb/mar 2009 it would be back up to $60.

I have watched it go from $96 down to $70 in the present cycle.They still pay the dividends that I live off in retirement.Come august they will declare a dividend and supply me with income to live off.I have no idea when they will get back to $96 but I am confident they will,at some point in the future that I and nobody else can predict.

As for losing money ,yes I have,Pasminco and babcock and brown.The gains from my very concentrated portfolio far outweigh the losses from those two stocks.

At some time in the future CBA will crash again.Unless they release results that say all hope is lost,then again,I wiil keep them.

All that can happen is time judges all men,time will tell if I got it right or wrong.nothing will ever be proved right or wrong by the number of people that agree or disagree with the facts.

Graham Hand
July 21, 2016

ABC News writes up this article, plus interview with FSC Head, Sally Loane.

http://www.abc.net.au/news/2016-07-21/industry-super-funds-outperform-retail-lower-share-exposure/7649306?section=business

Bill
July 21, 2016

Rob what were your returns including 2007 and 2008? i bet they weren't 15%+ p.a.

Rob
July 22, 2016

Of course not Bill, but the whole point of the exercise was to compare my 1 and 7 year averages to be consistent with the published table.

For the record, my returns were (19.7%) in FY08 and (7.5%) in FY09, which I think still compare very favourably.
Cheers

Rob
July 21, 2016

I tend to agree the "lower for longer" mantra is sometimes an excuse for laziness and to preposition punters for likely low performance by the funds management industry.

I am a retail investor running my own accumulation SMSF (~$1.4m) and also a personal share fund outside super (~$1.1m). I have been ~90% invested in growth assets at all times, including during the GFC.

SMSF performance in FY16 was 15.5% and over last 7 years has averaged 17% pa (no banks, no mining shares, no Telstra & no exotic or unlisted assets).
The personal share fund achieved 15.2% in FY16 and over last 7 years has also coincidentally averaged 15.2% pa.

I only quote these numbers to compare with those produced in the above table, and to demonstrate that if a mug punter like me can consistently achieve these results, being 90% growth invested through/after the GFC, then I believe much of the funds management industry is earning exorbitant fees under glaringly false pretenses.

Ashley
July 21, 2016

CALPERS is a woeful result.

Berkshire – personally as a long term BRK owner I don’t even look at the share price – honest. Nor does Buffett – he just reports underlying book value of the businesses – most of which are unlisted so it’s anybody’s guess what the numbers are. But the great growth of BRK plus un-hedged AUD have made it a tremendous investment

Should just use simple Asset Allocation techniques. Look at last year:

o Aust Equities: +2% from the passive index but nearly all active managers we use beat that handsomely

o Aust LTPs: +25% from the index – I just use passive ETFs

o Un-hedged global equities – index was dead flat but several active managers added value. I favour US which returned +4% (S&P500 TR) plus am un-hedged so currency return added +3% = 7%.

o Aust Fixed Inc – composite index returned a healthy +7% - I just use ETFs + favoured semi’s (same 7% return)

o Global bonds – global investment grade index returned +9%. I favour gov bonds - hedged AUD index returned +11% - I just use passive funds.

o Unlisted Aust commercial property returned 10-12%

So regardless of what the asset allocation was, why should investors “expect lower returns” when the half the asset classes did better than their long term averages – in nominal terms and especially after inflation and NO asset class had a big negative – which is unusually good.

‘Lower for longer’ is an excuse for laziness – like in the GFC when everybody who went down with the crowd said “sure I lost 50% but so did everybody else in the world, so don’t blame me!”

Chris
July 21, 2016

+1 to this and agree completely. CALPERS was a rubbish result and anyone with any modicum of investment knowledge could have done better. The fund members should be taking a serious look at who manages their money and how much they get paid.

I am like Ashley, I used predominantly domestic and global ETFs for my exposure, buy and hold and only when the valuations are right. It's boring but it works and with a modest (30%) amount of gearing, I know I am well ahead of the reported 'base' numbers.


Leave a Comment:

RELATED ARTICLES

Buffett on markets, cash and seizing opportunities

Three key takeaways from Buffett's annual letter

Buffett's meeting takeaway: extreme caution

banner

Most viewed in recent weeks

2024/25 super thresholds – key changes and implications

The ATO has released all the superannuation rates and thresholds that will apply from 1 July 2024. Here's what’s changing and what’s not, and some key considerations and opportunities in the lead up to 30 June and beyond.

The greatest investor you’ve never heard of

Jim Simons has achieved breathtaking returns of 62% p.a. over 33 years, a track record like no other, yet he remains little known to the public. Here’s how he’s done it, and the lessons that can be applied to our own investing.

Five months on from cancer diagnosis

Life has radically shifted with my brain cancer, and I don’t know if it will ever be the same again. After decades of writing and a dozen years with Firstlinks, I still want to contribute, but exactly how and when I do that is unclear.

Is Australia ready for its population growth over the next decade?

Australia will have 3.7 million more people in a decade's time, though the growth won't be evenly distributed. Over 85s will see the fastest growth, while the number of younger people will barely rise. 

Welcome to Firstlinks Edition 552 with weekend update

Being rich is having a high-paying job and accumulating fancy houses and cars, while being wealthy is owning assets that provide passive income, as well as freedom and flexibility. Knowing the difference can reframe your life.

  • 21 March 2024

Why LICs may be close to bottoming

Investor disgust, consolidation, de-listings, price discounts, activist investors entering - it’s what typically happens at business cycle troughs, and it’s happening to LICs now. That may present a potential opportunity.

Latest Updates

Shares

20 US stocks to buy and hold forever

Recently, I compiled a list of ASX stocks that you could buy and hold forever. Here’s a follow-up list of US stocks that you could own indefinitely, including well-known names like Microsoft, as well as lesser-known gems.

The public servants demanding $3m super tax exemption

The $3 million super tax will capture retired, and soon to retire, public servants and politicians who are members of defined benefit superannuation schemes. Lobbying efforts for exemptions to the tax are intensifying.

Property

Baby Boomer housing needs

Baby boomers will account for a third of population growth between 2024 and 2029, making this generation the biggest age-related growth sector over this period. They will shape the housing market with their unique preferences.

SMSF strategies

Meg on SMSFs: When the first member of a couple dies

The surviving spouse has a lot to think about when a member of an SMSF dies. While it pays to understand the options quickly, often they’re best served by moving a little more slowly before making final decisions.

Shares

Small caps are compelling but not for the reasons you might think...

Your author prematurely advocated investing in small caps almost 12 months ago. Since then, the investment landscape has changed, and there are even more reasons to believe small caps are likely to outperform going forward.

Taxation

The mixed fortunes of tax reform in Australia, part 2

Since Federation, reforms to our tax system have proven difficult. Yet they're too important to leave in the too-hard basket, and here's a look at the key ingredients that make a tax reform exercise work, or not.

Investment strategies

8 ways that AI will impact how we invest

AI is affecting ever expanding fields of human activity, and the way we invest is no exception. Here's how investors, advisors and investment managers can better prepare to manage the opportunities and risks that come with AI.

Sponsors

Alliances

© 2024 Morningstar, Inc. All rights reserved.

Disclaimer
The data, research and opinions provided here are for information purposes; are not an offer to buy or sell a security; and are not warranted to be correct, complete or accurate. Morningstar, its affiliates, and third-party content providers are not responsible for any investment decisions, damages or losses resulting from, or related to, the data and analyses or their use. To the extent any content is general advice, it has been prepared for clients of Morningstar Australasia Pty Ltd (ABN: 95 090 665 544, AFSL: 240892), without reference to your financial objectives, situation or needs. For more information refer to our Financial Services Guide. You should consider the advice in light of these matters and if applicable, the relevant Product Disclosure Statement before making any decision to invest. Past performance does not necessarily indicate a financial product’s future performance. To obtain advice tailored to your situation, contact a professional financial adviser. Articles are current as at date of publication.
This website contains information and opinions provided by third parties. Inclusion of this information does not necessarily represent Morningstar’s positions, strategies or opinions and should not be considered an endorsement by Morningstar.