Following two decades of ‘low-inflation’ in the 2000s and 2010s, inflation spiked up suddenly in 2021 after the Covid lockdowns unleashed a fiscal and monetary flood of cheap money. The ‘return’ of inflation in 2021 awakened a sudden resurgence in interest in the implications of inflation for investors.
Over the past couple of years, I have heard and read dozens of comments along the lines of: “Gee, we haven’t had to worry about inflation for so long, but now it’s back, we’d better take a look at inflation protection”.
The problem is that most advisers and portfolios managers have only ever experienced the wonderful disinflation boom since the early 1990s – a period when declining inflation and interest rates boosted nominal and real returns from every asset class.
Great returns made every asset manager look good – even, and especially bond fund managers - but it was mostly just lucky timing.
That wonderful low-inflation era is now gone, and so are the great returns from every asset class that came with it.
Before 2021, there was a widely held belief (even by central bankers) that inflation had magically been ‘solved’, so we no longer needed to worry about it anymore.
If inflation does return to the target levels (2-3% range in Australia, 2% in the US) – that does NOT mean the problem has gone away.
Even ‘low’ inflation destroys wealth
In reality, the wealth-destroying impacts of inflation never went away. Inflation has always been a silent, government-sponsored destroyer of the purchasing power of money, and therefore it critically important for investors, even in so-called ‘low inflation’ years.
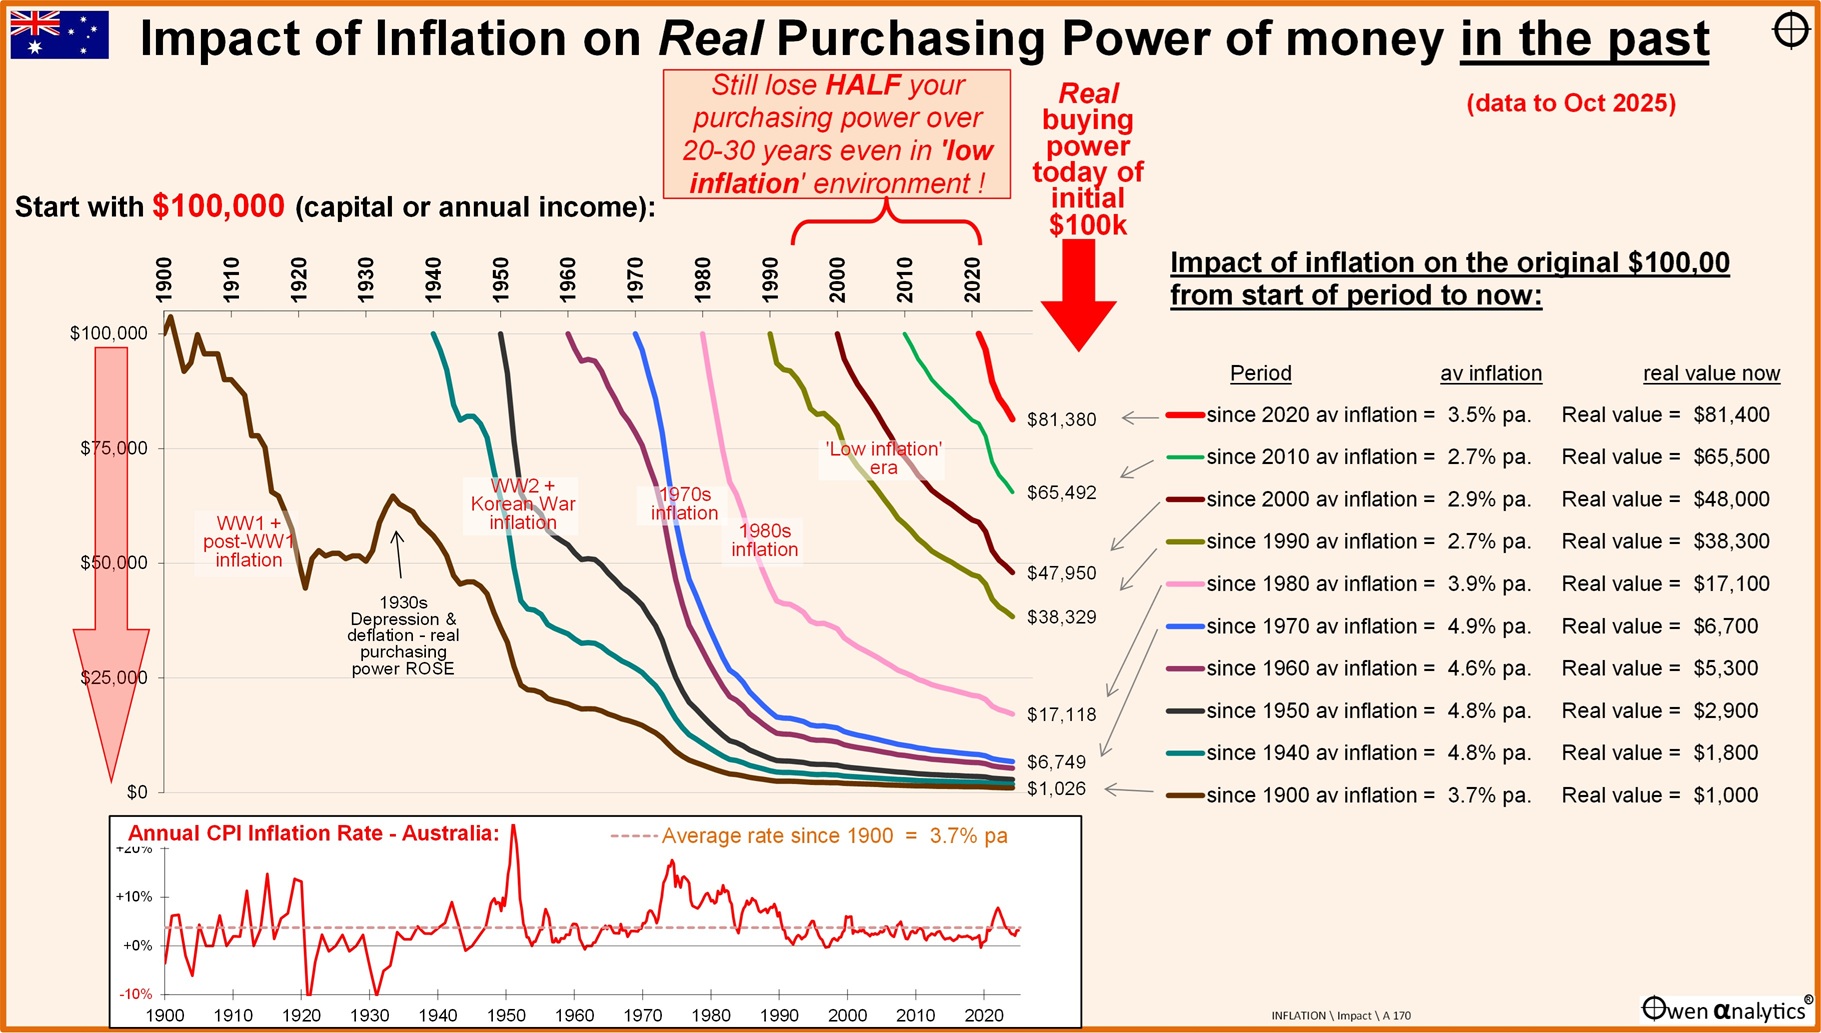
This chart shows the impact of inflation in Australia on $100,000 in assets or income, from different starting points.
Click to enlarge.
For example, take 1980 as a starting point (the pink curve near the middle of the chart). $100,000 of assets or income in 1980 was a lot of money at that time. Believe it or not, the median Sydney house price was just $69,000 in 1980! But $100,000 in 1980 dollars would have been whittled down to $17,000 in today’s dollars due to the compounding effects of inflation.
Another way of looking at it is this: if you had $100,000 in paper dollars in 1980 and locked it in a safe, if you opened the safe today you still have that same $100,000 in paper money, but it would only buy $17,000 worth of today’s goods and services. (Or, if you invested in bank term deposits in 1980 and you lived off the interest).
Inflation over the years since 1980 has eaten away 83% of its purchasing power.
With the 1980 ‘real’ (ie after inflation) value line (pink line starting from 1980), we can see that the real purchasing power of $100,000 in 1980 decayed very quickly during the high inflation 1980s, but then the rate of value decay eased off (a less steep downward value decay curve) in recent decades.
The section at the bottom of the chart shows the annual CPI inflation rate in Australia since 1900. In the past 50 years, inflation was very high in the 1970s, then declined in the 1980s, and was relatively ‘low’ in the 2000s and 2010s decades.
Destructive impact during ‘low inflation’ years
The problem is that, even in the so-called ‘low inflation’ years, inflation still had a very serious destructive impact on wealth and incomes.
For me, the most remarkable feature of this chart is the fact that the value destruction curves are still steeply negative even during the so-called ‘low inflation’ years. Look at how steeply negative the lines are for money starting in 1990 (grey), 2000 (brown), and 2010 (green).
For example, $100,000 starting in 1990 has been eaten away to a purchasing power of just $38,000 today.
$100,000 starting in 2000 has been eaten away to a purchasing power of just $48,000 today.
Even in the ultra-low inflation post-GFC years, $100,000 starting in 2010 has been eaten away to a purchasing power of just $65,000 today. That’s a big destruction of wealth and purchasing power in a relatively short period of time.
That’s one third of our wealth and living standards gone – permanently destroyed – in the so-called ‘low inflation era’.
2020s
In the current decade so far (up until October 2025), $100,000 at the start of 2020 has already lost 19% of its purchasing power, to just $81,000 today. We can see this in the short but very steep red value destruction curve to the right of the chart.
The downward slope of the 2020s wealth destruction curve is as steeply negative as the 1950s and 1980s wealth destruction curves on the chart.
The wealth-destroying effects of inflation never went away. Remember how central bankers dreamed about reviving inflation in the post-GFC years and in the Covid crisis - with their ‘positive inflation targeting’, zero interest rates, and their mad ‘QE’ (Quantitative Easing) money printing sprees. Likewise, governments with their free money hand-outs to anything that moved.
Well, they certainly succeeded in bringing back inflation (be careful what you wish for), and we are all paying for it now.
Unfortunately, even after more than half a decade after the Covid lockdown crisis, governments are still addicted to inflationary deficit-spending sprees.
And, for decades to come, our kids and grandkids will be paying for the debt that was borrowed by governments to fund the inflationary handouts. That’s a double-whammy of wealth destruction governments and their central banks have handed our kids – thanks for the debt, and thanks for the inflation!
Compounding in reverse
We all know about the benefits of compounding on investments. Albert Einstein is attributed as saying: “Compound interest is the eighth wonder of the world. He who understands it, earns it ... he who doesn't ... pays it”.
The destructive negative effect of inflation is compounding in reverse – Einstein’s “he who doesn’t [understand it] … pays it.”
Long-term investors, especially those who are (or will in the future be) relying on their savings to fund their living expenses, are heavily exposed to inflation, even so-called ‘low’ inflation.
Ashley Owen, CFA is Founder and Principal of OwenAnalytics. Ashley is a well-known Australian market commentator with over 40 years’ experience. This article is for general information purposes only and does not consider the circumstances of any individual. You can subscribe to OwenAnalytics Newsletter here.