Register For Our Mailing List

Register to receive our free weekly newsletter including editorials.

Home / 441

Morningstar asset class performance, 2021 and historical

The start of a new year is a good time to review portfolio performance and consider long-term settings for a financial future.

This article breaks Morningstar reporting into five tables to show market performance over all time periods to 30 years, as well as measures of risk and drawdowns. The chart on long-term performance shows Australian equities and listed property doing best since 1989. 

Table 1: Asset class performance from 1 month to 30 years

Table 2: Standard deviation (a measure of risk) by asset class

Table 3: Historical 1-year returns

Table 4: Historical 5-year returns

Table 5: Historical drawdown (market falls)

Tables sourced from Morningstar Adviser Research Centre.

Chart
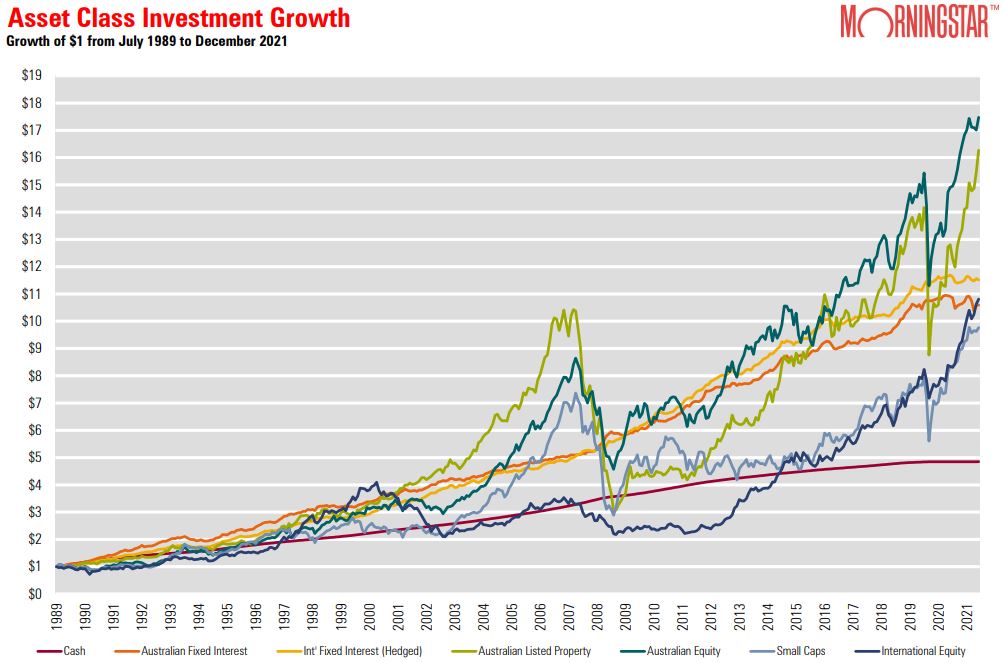
Source: Morningstar Adviser Research Centre.


Access data and research on over 40,000 securities through Morningstar Investor, as well as a portfolio manager integrated with Australia’s leading portfolio tracking service, Sharesight. Sign up to a free, four week trial below:


Try Morningstar Investor for free


  •   12 January 2022
  • 5
  •      
  •   
5 Comments
John
January 13, 2022

The chart included (showing relative performance of asset classes) is in a format that I have long considered poor because it is easily manipulated by merely changing the start date. My other criticism is that there is virtually no investor that has that exact experience.

Instead, I suggest an alternative.

Instead of starting with a dollar investment, some time in the past, instead produce a graph that has today as its end date, with each of the asset classes ending up with $100 invested, and the line of the graph says for each date on the horizontal axis, how much money would need to be invested to end up with the $100.

The highest performing asset class would in this graph be the one with the lowest amount of initial investment. The big advantage of this graph would be that any investor could select a start date, and see how much they needed to invest at that start date, in that asset class to end up with $100 now. You could see what proportion of investment dates (finishing today) would produce negative returns, and what proportion positive (or you could make a good guess along those lines)

Dudley
January 13, 2022

"with each of the asset classes ending up with $100 invested":

Better; then only need to time travel to make guaranteed outcome investments.

Tomorrow's race results are best.

Alexander Stitt
January 15, 2022

Wholeheartedly agree with John, that showing a common end point allows a much better understanding of where past performance differentials have arisen and overcomes the problem in the choice of start date; and I've long though this. A quick look at how different the results would be on the existing chart if the start date was 2006 vs 2009 easily illustrates the point. Maybe such a chart requires a bit more work from the user to comprehend, but is, in effect, just the tables of "past 1 years performance", "past 3 years performance", "past 10 years performance" put into a common chart with all time intervals on display all the way back to the chart start, not just the arbitrary "1 year", "3 year" "10 year" etc. observations.

I suspect Dudley, in his comment, did not fully understand what John was proposing.

Dudley
January 15, 2022

Been presenting semi-log cumulative total value normalised to 1 at current date for years.
More clearly shows relative growth rates.
Does not predict future.

D Ramsay
January 15, 2022

Could we please also get the modal values (i.e. mode = the most common score) into the Historical 1 and 5 -year returns into those tables please as it would give a perspective of how Normalized or Skewed the distribution is.


Leave a Comment:

RELATED ARTICLES

Diversification is not a free lunch

banner

Most viewed in recent weeks

The growing debt burden of retiring Australians

More Australians are retiring with larger mortgages and less super. This paper explores how unlocking housing wealth can help ease the nation’s growing retirement cashflow crunch.

Four best-ever charts for every adviser and investor

In any year since 1875, if you'd invested in the ASX, turned away and come back eight years later, your average return would be 120% with no negative periods. It's just one of the must-have stats that all investors should know.

LICs vs ETFs – which perform best?

With investor sentiment shifting and ETFs surging ahead, we pit Australia’s biggest LICs against their ETF rivals to see which delivers better returns over the short and long term. The results are revealing.

Family trusts: Are they still worth it?

Family trusts remain a core structure for wealth management, but rising ATO scrutiny and complex compliance raise questions about their ongoing value. Are the benefits still worth the administrative burden?

13 ways to save money on your tax - legally

Thoughtful tax planning is a cornerstone of successful investing. This highlights 13 legal ways that you can reduce tax, preserve capital, and enhance long-term wealth across super, property, and shares.

Our experts on Jim Chalmers' super tax backdown

Labor has caved to pressure on key parts of the Division 296 tax, though also added some important nuances. Here are six experts’ views on the changes and what they mean for you.        

Latest Updates

Retirement

Why it’s time to ditch the retirement journey

Retirement isn’t a clean financial arc. Income shocks, health costs and family pressures hit at random, exposing the limits of age-based planning and the myth of a predictable “retirement journey".

Financial planning

How much does it really cost to raise a child?

With fertility rates at a record low, many say young people aren’t having kids because they’re too expensive. Turns out, it’s not that simple and there are likely other factors at play.

Exchange traded products

Passive ETF investors may be in for a rude shock

Passive ETFs have become wildly popular just as markets, especially the US, reach extreme valuations. For long-term investors, these ETFs make sense, though if you're investing in them to chase performance, look out below.

Shares

Bank reporting season scorecard November 2025

The Big Four banks shrugged off doomsayers with their recent results, posting low loan losses, solid margins, and rising dividends. It underscores their resilience, but lofty valuations mean it’s time to be selective. 

Investment strategies

The real winners from the AI rush

AI is booming, but like the 19th-century gold rush, the real profits may go to those supplying the tools and energy, not the companies at the centre of the rush.

Economy

Why economic forecasts are rarely right (but we still need them)

Economic experts, including the RBA, get plenty of forecasts wrong, but that doesn't make such forecasts worthless. The key isn't to predict perfectly – it's to understand the range of possibilities and plan accordingly.

Strategy

13 reflections on wealth and philanthropy

Wealth keeps growing, yet few ask “how much is enough?” or what their kids truly need. After 23 years in philanthropy, I’ve seen how unexamined wealth can limit impact, and why Australia needs a stronger giving culture.

Sponsors

Alliances

© 2025 Morningstar, Inc. All rights reserved.

Disclaimer
The data, research and opinions provided here are for information purposes; are not an offer to buy or sell a security; and are not warranted to be correct, complete or accurate. Morningstar, its affiliates, and third-party content providers are not responsible for any investment decisions, damages or losses resulting from, or related to, the data and analyses or their use. To the extent any content is general advice, it has been prepared for clients of Morningstar Australasia Pty Ltd (ABN: 95 090 665 544, AFSL: 240892), without reference to your financial objectives, situation or needs. For more information refer to our Financial Services Guide. You should consider the advice in light of these matters and if applicable, the relevant Product Disclosure Statement before making any decision to invest. Past performance does not necessarily indicate a financial product’s future performance. To obtain advice tailored to your situation, contact a professional financial adviser. Articles are current as at date of publication.
This website contains information and opinions provided by third parties. Inclusion of this information does not necessarily represent Morningstar’s positions, strategies or opinions and should not be considered an endorsement by Morningstar.