The global stock market Olympics race to beat their pre-GFC stock market highs was won by Denmark, followed by the USA and the UK. As with our story on Denmark last week, it is illuminating to compare Australia with both Uncle Sam and Old Blighty.
In second place, the USA
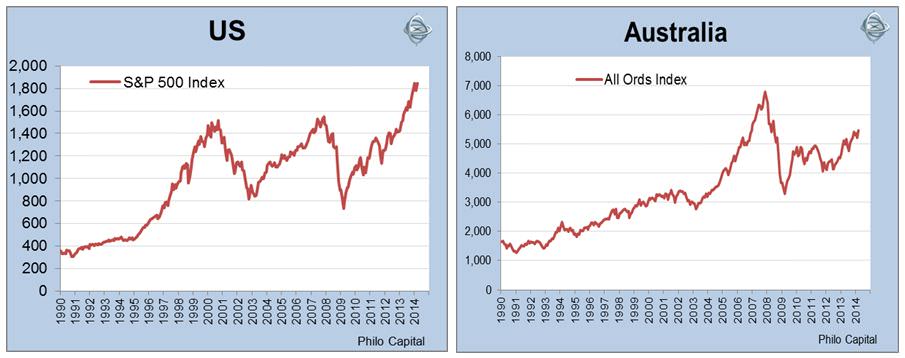
The US S&P 500 index peaked at 1,527 on 24 March 2000 at the height of the dot-com frenzy, and beat that level with a new high of 1,565 on 9 October 2007. It then promptly plunged 57% in the GFC to a trough that was lower even than the bottom of the 2001-2002 ‘tech-wreck’. In March 2013, the index finally rose above its dot-com and 2007 highs.
Since the 2007 peak, US dividends have averaged 2.3% pa but US CPI inflation has averaged 2.0% pa, so the real total return chart (including dividends but after inflation) is virtually the same as the nominal price chart shown above (excluding dividends but before inflation).
Like Denmark, the US suffered a sharp domestic contraction, its longest and deepest recession since the 1930s depression. The US economy has been saved from deflation and further contraction by the Federal Reserve’s zero interest rate policy and its unprecedented asset buying programme. Unemployment rates reached 10% in the sub-prime crisis and are still well above the long term average.
The US is a very different country to Denmark, especially in relation to size of government, level of government control over the economy, level of regulation, role and power of unions, welfare spending levels and tax burdens.
US brain power
Despite these stark differences in economic structure and policy, when it comes to the source of value added for its listed companies, the two countries are similar in that companies rely primarily on brain-power and not raw commodities. The astronomically-priced ‘new economy’ US stocks of the dot-com era, and other newer companies that have followed in their footsteps, are now driving the global technology boom. The smart phones, tablets, notebooks and laptops may be assembled in the sweatshops of Asia and Latin America but the know-how, the big margins and profits are earned mainly by American companies like Apple, Google, Microsoft, Intel, Amazon, eBay, Oracle, Hewlett-Packard, etc.
In addition the US is home to numerous global companies like McDonalds, Coca-Cola, PepsiCo, Proctor & Gamble, Philip Morris, Altria (Marlboro cigarettes), Pepsi, Nike, Starbucks, Yum Brands (KFC, Pizza Hut Taco Bell), Colgate Palmolive, and Kelloggs. In the media sector there are the likes of Disney, News/Fox and Time Warner. Fedex and UPS are also benefiting from the global shift to online retailing.
Much of America’s bloated banking sector was crippled in the GFC but was cleaned up quickly through nationalisations, re-capitalisations and restructures. The US financial sector is now rolling in obscene profits again. The US is also home to Visa, Mastercard and Amex, which are turning into the new virtual banking giants in emerging markets that lack traditional bricks & mortar banking networks.
Further, the US is home to global healthcare and biotech giants Johnson & Johnson, Pfizer, Merk, Bristol-Byers, Abbot Labs and a host of others. Manufacturers include GE, Proctor & Gamble, 3M, Boeing, Du Pont, Dow Chemical, General Dynamics, Lockheed Martin. There are a handful of major oil and gas stocks driving the US energy boom (Exxon Mobil, Chevron, etc) but virtually no miners of any consequence.
Underpinned by earnings and dividends
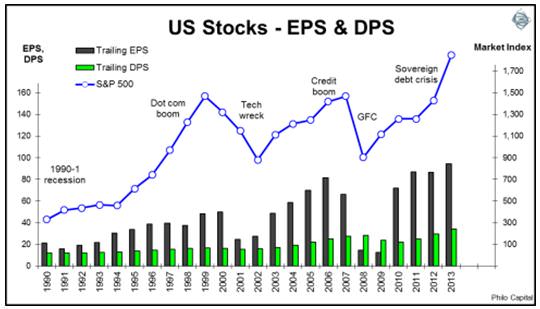
Despite high unemployment levels and sluggish growth in the US, the corporate sector is more profitable than ever. Earnings per share and cash dividends per share are well above their 2007 boom-time highs.
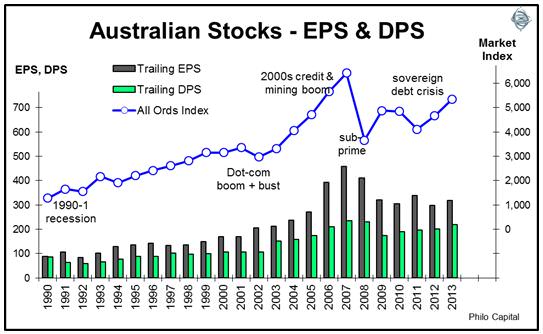
In Australia, dividends per share across the market are still below their pre-crash levels, and earnings per shares are still well below pre-crash levels, after six years of higher inflation and higher population growth than the US.
Share buy-backs generate cash for investors
Another feature of the US market in recent years has been the high level of stock buy-backs. Across the S&P500 market, cash dividends are running at about USD80 billion per quarter (giving a 2% dividend yield), but cash buy-backs are running well above USD100 billion per quarter and increasing steadily. This equates to an additional 3% cash yield for investors who accept the buybacks. Those who decline benefit from higher dividends per share over time.
Aside from 2009, buybacks have exceeded dividends paid across the US market in every year since 2003.
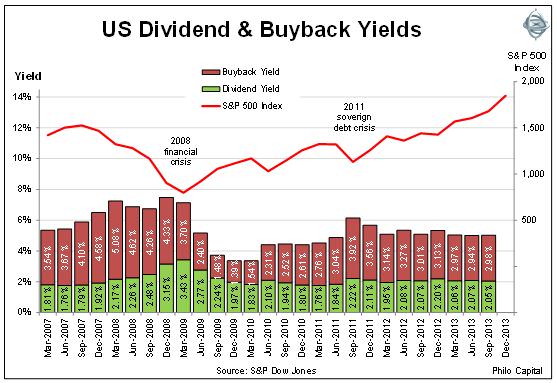
Since 2007, US companies have paid out a total of USD2.5 trillion in buybacks, which is more than 50% higher than the USD1.6 trillion they have paid in total dividends. Dividend payout ratios across the US market are currently around 36%, which is below the post 1980 median of 43%, leaving companies sitting on mountains of cash for future investments, acquisitions or buybacks.
In contrast, Australian companies have been increasing their dividend payout ratios, to nearly double the US payout ratio. Increasing dividends by increasing payout ratios may look good on the surface but it merely robs the company’s future earnings growth potential in order to placate short-sighted yield-chasing shareholders today.
In summary, the US stock market has delivered much stronger returns than Australia since the GFC, and this superior performance has been underpinned by superior growth in earnings, dividends and cash buy-backs. This has been in spite of, or perhaps partially because of, the much weaker economic conditions in the US compared to the relatively benign conditions in Australia.
In third place, the UK
Like the US, the UK market also had an astronomical dot-com boom in 1999-2000. The all-time peak for the FTSE-100 index was 6,930, reached on the last day of December in 1999. This was not even beaten in the great 2003-2007 credit bubble, although it came close.
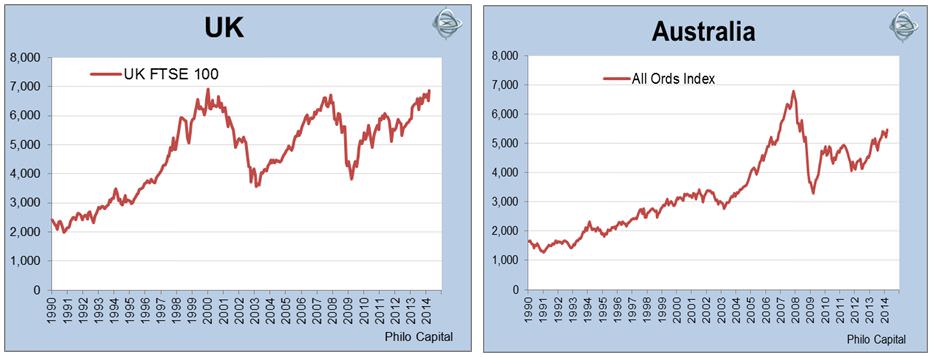
Finally, 14 years after its peak, the long wait for a new high is almost over. On 22 May 2013 the index reached 6,840, just 1% away from its dot-com peak of 6,930. Now (in late February 2014) it is once again near its peak.
The UK economy has drifted in and out of recession since 2008 and has suffered massive bank losses and nationalisations, high unemployment, weak consumer spending and sluggish business investment, but share prices have soared.
Since 2007, dividends have averaged 3.7% pa and CPI inflation has averaged 3.2% pa, so the real total return performance is a fraction better than the price performance.
Like the Australian market, the UK stock market has two large, low value-adding sectors that are under both cyclical and structural pressures – miners and banks. The miners have been affected by falling commodity prices, while UK banks suffered badly in the GFC. Although the UK local economy has been weak since 2008, bank share prices have bounced back strongly.
However, unlike Australia, the UK market is also home to several large global consumer firms that continue to do well notwithstanding the stagnant growth in the UK and Europe. Companies like Unilever, British-American Tobacco, Imperial Tobacco, SAB Miller, Diageo, Reckitt, Burberry, and many others. Success is mainly by the burgeoning middle classes in emerging markets.
The pound has done the UK few favours. Although falling dramatically in the GFC (it was the only currency that fell by more than the Australian dollar in the GFC), it has been strong since 2008. The Bank of England has been trying desperately to depreciate the pound with its QE programme, but to date has had little success in the global currency war, up against the might of the US Fed, the Bank of Japan and the ECB. UK companies and share prices have done well despite the relatively high currency.
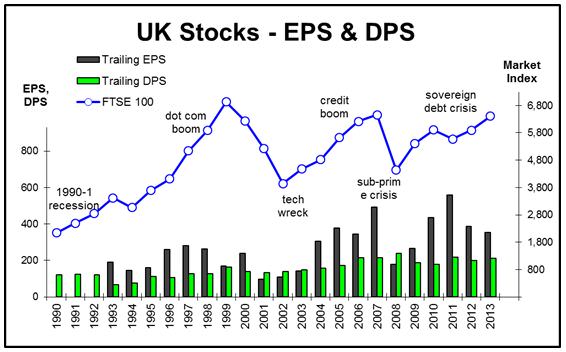
British company earnings per share and dividends per share are now significantly higher than their dot-com boom levels (when the stock market peaked) but still shy of their 2007 boom-time levels.
Ashley Owen is Joint CEO of Philo Capital Advisers and a director and adviser to the Third Link Growth Fund.