Conventional wisdom suggests that ‘time in the market’ is a less risky strategy than ‘timing the market’. Boom and gloom provide attractive entry and exit points but only if the timing is right. Accurately identifying market peaks and troughs is notoriously difficult. In our experience, gradually allocating more to markets during times of market distress and less when ‘everything is awesome’ is a preferable approach.
Small caps, and in particular, industrials, present an opportunity for investors at current levels. The Small Ordinaries benchmark has underperformed the ASX100 since November 2021. Notably, industrials have underperformed resources, which have been supported by thematics such as energy security, battery materials, and gold. In addition, adjusting to tighter monetary policy has weighed on small industrials. The recent underperformance presents a chance for investors to incrementally allocate to the sector.
Small Ordinaries relative to ASX 100
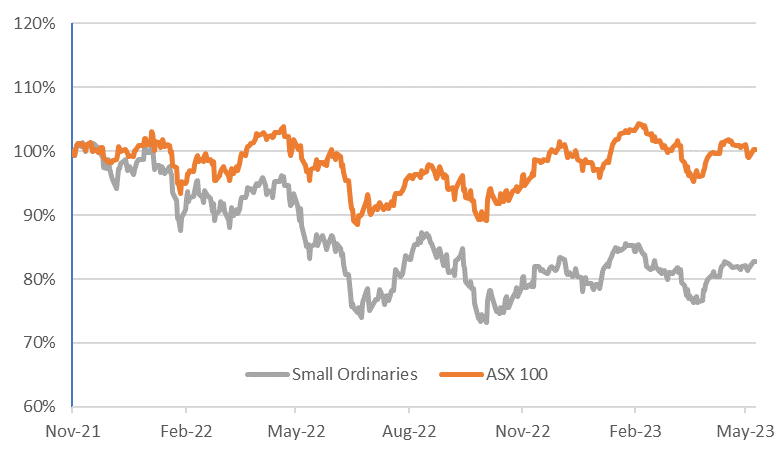
Source: Novaport Capital, IRESS
Falling liquidity signals capitulation
Investors’ willingness to trade reveals their confidence, or lack thereof, in the market. Rising liquidity can create a virtuous circle during a bull market, when abundant liquidity entices more capital into markets (attracted by lower trading costs). Yet when liquidity falls and markets are falling, the cycle works in reverse. Capital ceases to flow to (or exits) the market due to illiquidity concerns.
Small Industrials Quarterly Share Turnover (million shares)
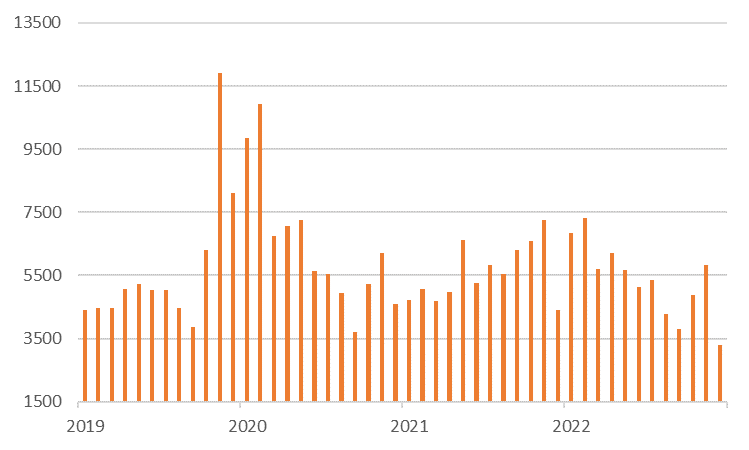
Source: Iress
Since November 2021, liquidity in the small industrials sector has dropped meaningfully. In 2023, the daily average value of turnover for small industrials has been $704 million, down a third (from $1.07 billion) during the same period in 2021. The decline in liquidity indicates that a lower amount of new money is being put to work in Small Caps. Contrarian investors have a better chance of picking up a bargain now, relative to last year.
Microcaps have been hit hardest
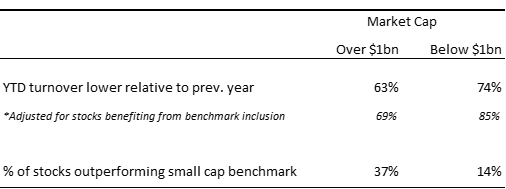
Not surprisingly, the decline in liquidity has been most pronounced for the smallest of small caps. 74% of the smaller small industrials (with a market capitalisation of less than $1 billion) had lower turnover in the last 12 months relative to the previous year. Adjusting for stocks which benefited from index inclusion, 85% of companies saw turnover decline. The impact on liquidity has been lower for the larger small companies, 63% had lower turnover (or 69% adjusting for index changes). Unsurprisingly, 37% of ‘larger’ small caps (market cap >$1 billion) outperformed the benchmark relative to a mere 14% of the ‘smallest’ companies.
One of NovaPort’s holdings, Quantum Intellectual Property Ltd [ASX:QIP], provides a case study of the current dynamic in microcaps. Quantum has a meaningful and growing share of the Australian Patent, Trademark and IP Legal Services market. Over the last year, its share price has fallen by 19%, materially under-performing the small cap benchmark. On our estimates, the company trades on an attractive discount to earnings and yield metrics relative to the broader market, however its share turnover is 23% lower than the previous year. In a recent market update, the company reaffirmed expectations for organic growth, improving margins and further consolidation opportunities. The decline in liquidity merely reflects that the stock has fallen off the market’s radar in our view, creating an investment opportunity. Quantum is just one example of similar opportunities arising in the current market environment.
Different exposures than large caps
The Australian stock market is heavily weighted towards highly profitable bank and resources stocks. The smaller end of the market has a wider range of exposures, from resource exploration stocks and retailers to fast growing technology businesses. The composition of the small caps benchmark evolves over time. Furthermore, industrial companies are less risky than three years ago. We estimate that loss making companies are now only 5% of the small industrials’ universe, down from over 30% before the pandemic. The current small cap market has a lower exposure to risky, early stage, or loss-making companies.
Following the recent underperformance of small caps, we see attractively priced opportunities relative to the large cap universe. For example, Domain Holdings [ASX:DHG] offers faster growth than REA Group [ASX:REA] (as it increases market penetration), yet it trades at a discount. At the same time, small cap building materials companies in markets with high barriers to entry, trade at through cycle earnings multiples in the mid-teens, despite having more favourable industry structures relative to historical averages.
Smaller companies have traditionally been more volatile and sensitive to the economic environment, which is expected to be challenging. There are valid reasons to be cautious. However, the small industrials benchmark is comprised of more robust businesses post the 2022 market correction. Its underperformance relative to large caps and the withdrawal of liquidity suggests the market is already fearful. This presents us with an opportunity to increase our exposure to quality, but overlooked, businesses.
Sinclair Currie is a Principal and Co-Portfolio Manager at NovaPort Capital, a boutique Australian equities investment manager specialising in small and microcap ASX-listed companies. This article is for general information only and does not consider the circumstances of any individual.