Register For Our Mailing List

Register to receive our free weekly newsletter including editorials.

Home / 360

Three realities and three mistakes in market recoveries

If market declines make you nervous, then you’re not alone. Especially now, when COVID-19 and its economic impact are fuelling feelings of uncertainty around the world.

But while bear markets can be extraordinarily difficult, they also can be moments of great opportunity. Investors who find the courage and conviction to stick to their long-term plans are often rewarded as markets bounce back. To help put recent markets into perspective, we outline three facts about market recoveries and three mistakes that investors should avoid.

Three facts about market recoveries

Fact #1: Recoveries have been much longer and stronger than downturns

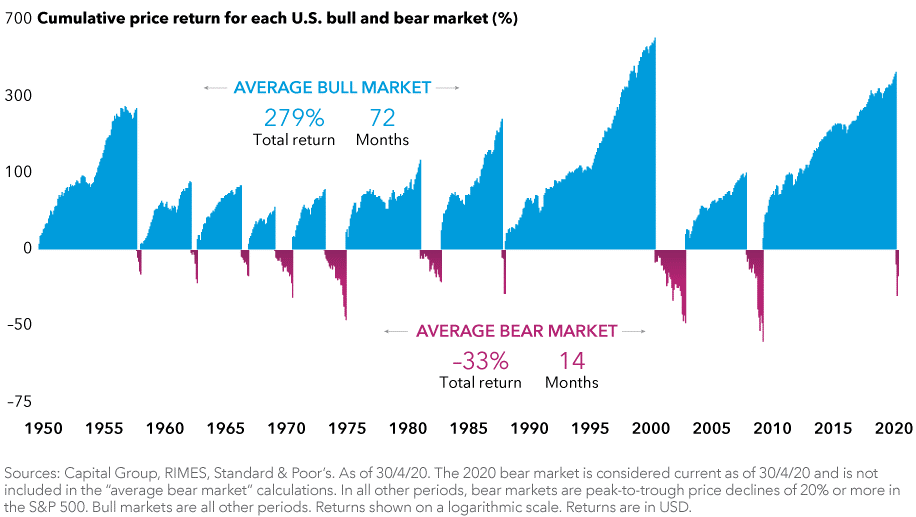
The good news is bear markets have been relatively short compared with recoveries. They can feel like they last forever when we’re in them but in reality, they are much less impactful compared to the long-term power of bull markets.

Although every market decline is unique, in the US, the average bear market since 1950 has lasted 14 months. The average bull market has been more than five times longer.

The difference in returns has been just as dramatic. Even though the average bull has averaged a 279% gain, recoveries are rarely a smooth ride. Investors must often withstand scary headlines, significant market volatility and additional equity declines along the way. But investors who remain focused on the long term are often better equipped to look past the noise and stick to their plan.

Fact #2: After large declines, markets have recovered quickly

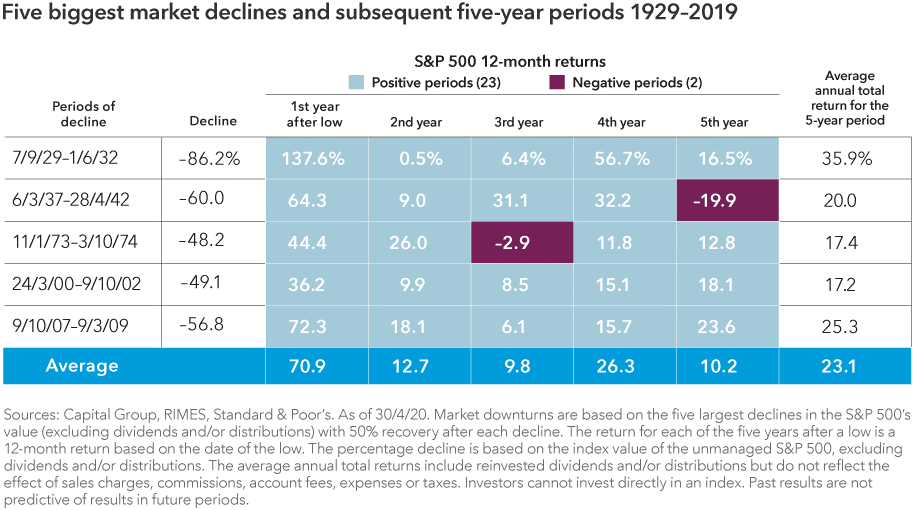
Of course, we don’t know exactly what the next recovery will look like, but history shows us that stocks have often recovered sharply following steep downturns. We tracked the 18 biggest US market declines since the Great Depression, and in each case the S&P 500 was higher five years later. Returns over those five-year periods averaged more than 18% per year.

Returns have often been strongest after the steepest declines, bouncing back quickly from market bottoms. The first year following the five biggest bear markets over the last 90 years averaged 71%, underscoring the importance of staying invested and avoiding the urge to abandon stocks during market volatility.

Fact #3: Some of the world’s most influential companies were born during market recoveries

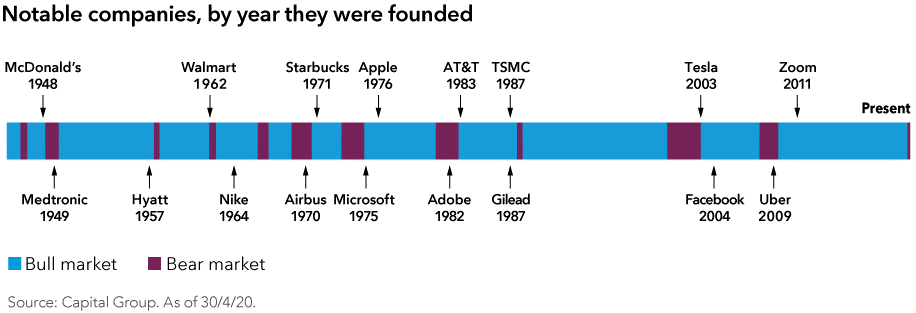
Many companies started during tough economic periods and have gone on to become household names.

To highlight just a few in the US market:

  • McDonald’s emerged in 1948 following a downturn caused by the US government’s demobilisation from a wartime economy.
  • Walmart came along 14 years later, around the time of the ‘Flash Crash of 1962’, a period when the S&P 500 index declined more than 22%.
  • Airbus, Microsoft and Starbucks were founded during the stagflation era of the 1970s, a decade marked by two recessions and one of the worst bear markets in US history.
  • Not long after that, Steve Jobs walked into his garage and started a computer company called Apple.

History has shown that strong businesses find a way to survive and even thrive when times are tough. Those that can adapt to difficult conditions and become stronger often make attractive long-term investments.

Bottom-up, fundamental research is key to separating which companies may help lead a market recovery, and which are more likely to be left behind.

Three mistakes investors should avoid

Mistake #1: Trying to time markets

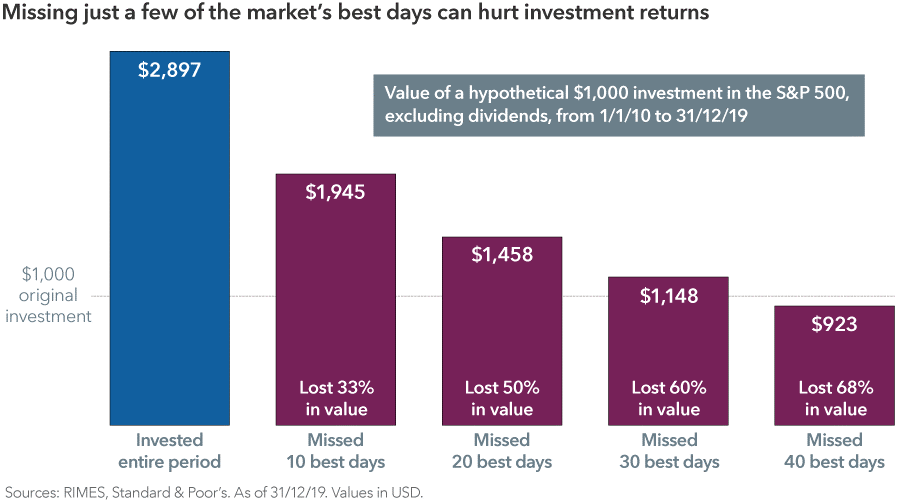
It’s time, not timing, that matters in investing. Taking your money out of the market on the way down means that if you don’t get back in at exactly the right time, you can’t capture the full benefit of a recovery.

Consider an example of a hypothetical investor who sold stocks during the US market downturn of 2008–2009, and then tried to time the market, jumping back in when it showed signs of improvement. Missing even the 10 best days of the recovery would have significantly hurt that investor’s long-term results. The more of the 'good' days were missed, the steeper the loss.

Investors who are more hesitant to put all their excess capital to work at once may want to consider dollar cost averaging, which often provides stability in volatile markets.

Mistake #2: Assuming today’s negative headlines make it a bad time to invest

Today’s economic and geopolitical challenges may seem unprecedented, but a look through history shows that there have always been reasons not to invest. Despite negative headlines, the market’s long-term trend has always been higher.

Consider an investment in the S&P 500 on the day Pearl Harbour was bombed in 1941. Someone who stayed invested for the next 10 years would have averaged a 16% annual return. Likewise, a $10,000 investment in the S&P 500 Index on the day Lehman Brothers declared bankruptcy in 2008 would have grown to over $30,000 10 years later. History has provided numerous examples of this.

Great investment opportunities often emerge when investors are feeling most pessimistic. The coronavirus outbreak may be unlike anything we have faced before but uncertainty is nothing new to the market, which continues to be resilient over time.

Mistake #3: Focusing too much on the short term

Market volatility is especially uncomfortable when you focus on short-term ups and downs. Instead, extend your time horizon to focus on the long-term growth of your investments and the progress you’ve made toward your goals.

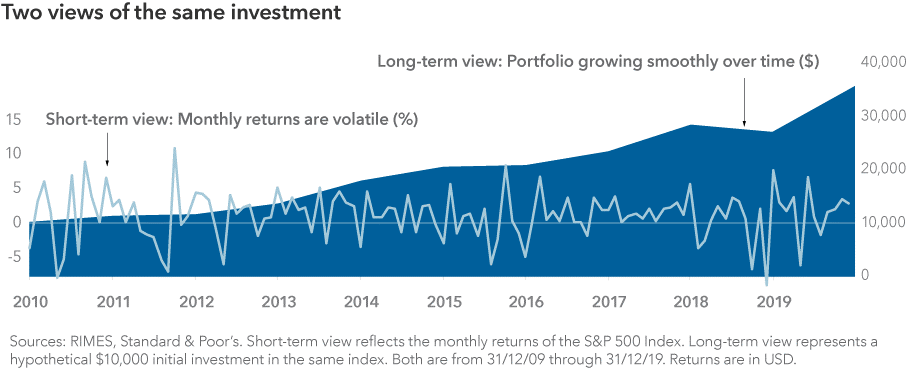
Consider the chart below that shows contrasting perspectives of the same hypothetical investment. The short-term view is one that many investors have of their portfolios, tracing returns over short periods of time.

The long-term view plots the same investment over the same period, but shows annual change in the portfolio value invested instead. With this perspective, the short-term fluctuations have smoothed out over time, and the picture of a growing portfolio becomes clearer.

Bear markets don’t last forever. Maintaining a long-term perspective can help investors to focus on the goals that matter most.


Matt Reynolds is an Investment Director at Capital Group, a sponsor of Firstlinks. This article is general information and does not consider the circumstances of any investor. Please seek financial advice before acting on any investment as market circumstances can change.

For more articles and papers from Capital Group, click here.


  •   3 June 2020
  • 4
  •      
  •   
4 Comments
John
June 03, 2020

The "missing the best 10 days" argument always causes me concern.

What are the chances of an investor actually doing this? Well, simple maths. Probability of missing the best day in 10 years is obviously one chance in 3650. The chance of missing the two worst days, roughly one chance in 3650*3650 - and the chance of missing JUST the 10 best days over a 10 year period happening purely by chance is roughly 1 with 30 zeros after it - a huge number - the same as winning lotto several weeks in a row. It just isn't going to happen.

But, then you also need to look at when the ten WORST days happen. And believe it or not, the 10 WORST days in the stock market just happen to have occurred close to when the BEST 10 days were.

So in all likelihood, if you missed out on the 10 best days, you probably missed out on many of the 10 WORST days too (unless you were really Good/bad) and were out of the market for the 10 best days, and were in the market for the 10 worst days.

Chances of that? Even longer odds than winning lotto many weeks in a row.

So while I agree with the sentiments expressed in the article (about staying in the market), the author has effectively made the correct recommendation, but for an incorrect reason.

Lachlan
July 05, 2020

Hi John,

I think you've made a good point here about the probability of an investor selecting the 10 "best" days to re-invest, however i don't think this completely dismisses the Author's argument.

Firstly, the probability of hitting the 10 best days is as follows:
P(10 best days in 2010-2019) = (10/3065)*(9/3064)*(8/3063) etc... (Since you can't hit the same day twice)

Secondly, the probability of missing the 10 best days is as follows:
P(Missing the 10 best days in 2010-2019) = 1- P(10 best days in 2010-2019) or (3055/3065)*(3054/3064)*(3053/3064)...etc...

Both are very useless numbers with respect to timing the market, however, what the Author is illustrating is the importance of time *in* the market. Sure, this can be more accurately represented by showing net market increases over the period, rather than showing the gains from being in the market for the 10 best days, but the Author illustrates two things:
1. Missing the 10 best days by not being in the market leads to significant decline in return.
2. The earlier you start, the more "best" days you'll benefit from.

If the argument then is "but what if you invest on all the worst days", then, as the author suggested, dollar-cost-averaging is the optimal solution for any investor.

I hope this makes the argument a little clearer for yourself and any future readers.

- Lach

Bill
June 04, 2020

The benefit of hindsight is 2020 Every crisis seems different especially the covid-19. What assurance do we have that the worst is yet to come?

Ian Radbone
June 08, 2020

Thanks John, for pointing out something that hadn't occurred to me before.


Leave a Comment:

RELATED ARTICLES

5 insights that put market volatility in perspective

The ASX's 16-year drought: a rebuttal

Suddenly, the market cares if a company makes money (again)

banner

Most viewed in recent weeks

Retirement income expectations hit new highs

Younger Australians think they’ll need $100k a year in retirement - nearly double what current retirees spend. Expectations are rising fast, but are they realistic or just another case of lifestyle inflation?

Four best-ever charts for every adviser and investor

In any year since 1875, if you'd invested in the ASX, turned away and come back eight years later, your average return would be 120% with no negative periods. It's just one of the must-have stats that all investors should know.

Why super returns may be heading lower

Five mega trends point to risks of a more inflation prone and lower growth environment. This, along with rich market valuations, should constrain medium term superannuation returns to around 5% per annum.

The hidden property empire of Australia’s politicians

With rising home prices and falling affordability, political leaders preach reform. But asset disclosures show many are heavily invested in property - raising doubts about whose interests housing policy really protects.

Preparing for aged care

Whether for yourself or a family member, it’s never too early to start thinking about aged care. This looks at the best ways to plan ahead, as well as the changes coming to aged care from November 1 this year.

Our experts on Jim Chalmers' super tax backdown

Labor has caved to pressure on key parts of the Division 296 tax, though also added some important nuances. Here are six experts’ views on the changes and what they mean for you.        

Latest Updates

A speech from the Prime Minister on fixing housing

“Fellow Australians, I want to address our most pressing national issue: housing. For too long, governments have tiptoed around problems from escalating prices, but for the sake of our younger generations, that stops today.”        

Taxation

Family trusts: Are they still worth it?

Family trusts remain a core structure for wealth management, but rising ATO scrutiny and complex compliance raise questions about their ongoing value. Are the benefits still worth the administrative burden?

Exchange traded products

Multiple ways to win

Both active and passive investing can work, but active investment doesn’t in the way it is practised by many fund managers and passive investing doesn’t work in the way most end investors practise it. Here’s a better way.

Economy

The Future Fund may become a 'bad bank' for problem home loans

The Future Fund says it will not be paying defined benefit pensions until at least 2033 - raising as many questions as answers. This points to an increasingly uncertain future for Australia's sovereign wealth fund.

Investment strategies

Managed accounts and the future of portfolio construction

With $233 billion under management, managed accounts are evolving into diversified, transparent, and liquid investment frameworks. The rise of ETFs and private markets marks a shift in portfolio design and discipline. 

Property

Commercial property prospects are looking up

Commercial property is seeing the same supply issues as the residential market. Given the chronic undersupply and a recent pickup in demand, it bodes well for an upturn in commercial real estate prices.

Infrastructure

Private toll roads need a shake-up

Privatised toll roads in Australia help governments avoid upfront costs but often push financial risks onto taxpayers while creating monopolies and unfair toll burdens for commuters and businesses.

Sponsors

Alliances

© 2025 Morningstar, Inc. All rights reserved.

Disclaimer
The data, research and opinions provided here are for information purposes; are not an offer to buy or sell a security; and are not warranted to be correct, complete or accurate. Morningstar, its affiliates, and third-party content providers are not responsible for any investment decisions, damages or losses resulting from, or related to, the data and analyses or their use. To the extent any content is general advice, it has been prepared for clients of Morningstar Australasia Pty Ltd (ABN: 95 090 665 544, AFSL: 240892), without reference to your financial objectives, situation or needs. For more information refer to our Financial Services Guide. You should consider the advice in light of these matters and if applicable, the relevant Product Disclosure Statement before making any decision to invest. Past performance does not necessarily indicate a financial product’s future performance. To obtain advice tailored to your situation, contact a professional financial adviser. Articles are current as at date of publication.
This website contains information and opinions provided by third parties. Inclusion of this information does not necessarily represent Morningstar’s positions, strategies or opinions and should not be considered an endorsement by Morningstar.