It’s not quite Noah’s Ark with two of everything, but funds management in Australia is a zoo of different creatures, and who’s who is a complicated picture. There are platforms, unlisted managed funds, listed funds, superannuation funds, SMSFs, wholesale, retail, institutional … where do we stop and how are they related?
There will be some big numbers in this article, so let's make it clear:
- A billion is a thousand million
- A trillion is a thousand billion
Focus on the billions and trillions and soon, we’re talking serious amounts of money. A note of caution on the numbers, as even the Australian Bureau of Statistics (ABS) says:
“The managed funds industry is difficult to measure because of the many inceptions and winding-up of funds each quarter, due to the large amount of financial interactions between managed funds institutions and investment managers, and between investment managers themselves. Consequently, double counting of funds which are ‘churning’ through the system needs to be considered in order to derive a net measure of the managed funds industry.”
With such qualifications on data sources, we bring together:
- Fund managers
- Total managed funds
- Superannuation assets
- Industry and retail super funds
- Self-Managed Super Funds
- Wraps and platforms
- Listed funds (ETFs, LICs, property, infrastructure)
Global context among largest managers
Let’s put Australia in a global context.
Australians like to think we punch above our weight in most things, and the compulsory superannuation places our retirement system among the largest in the world. But in asset management generally, the combined funds under management (FUM) of all the asset managers in Australia is less than the biggest individual managers in the US: BlackRock ($14 trillion), Vanguard ($13 trillion) and Fidelity International ($7 trillion). Only one Australian manager, Macquarie, is in the Top 100 in the world, managing less than $1 trillion.
Based on an October 2022 report by the Thinking Ahead Institute (TAI), total discretionary FUM of the 500 largest managers (excluding superannuation funds) in the world totals USD132 trillion, or over AUD200 trillion. That’s 200 thousand billion. The Institute reports Australian fund managers hold only 1.4% of the assets of the 500 managers. The US is at 54.7% and rising over time.
Distribution of assets by fund manager country of origin
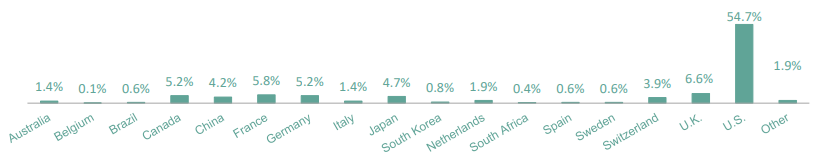
Source: Thinking Ahead Institute
1. Fund managers
There have been so many changes in Australian funds management in the last year or two that the latest TAI data published in October 2022 but using 2021 data is now out-of-date. IFM Investors is listed as second (but ranked globally 157th) to Macquarie, the three following Australian names – AMP Capital (ranked 159th), MLC Asset Management (ranked 160th) and Pendal (ranked 184th) – have significantly restructured. Further down the TAI list but in the Top 10 in Australia and 232nd in the world is Magellan, but it’s probably not in the Top 500 any longer. The other names on the list of the Top 10 Australians are Challenger (211th), Perpetual (234th), Pinnacle (239th) and QIC (242nd).
Another measure of the largest local fund managers in the wholesale/institutional space, from Plan for Life, gives this break up of $1.3 trillion under management. The leading role of SSGA and Vanguard shows their dominance in providing index funds to institutions, although Vanguard has stepped away to focus on retail and adviser distribution.
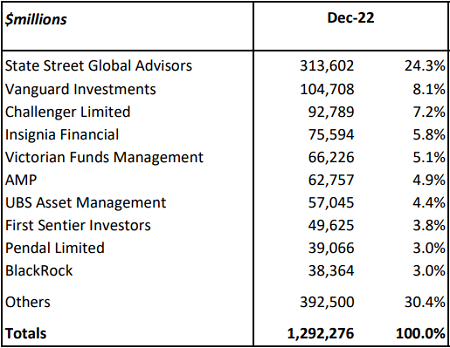
Source: Plan for Life
2. Total managed funds
The ABS defines managed funds as the assets of financial institutions that pool funds for investment. It covers industry funds, retail funds and other funds managers who provide professional investment services, and despite the definition, it also includes SMSFs.
In March 2023, total managed funds were $4.5 trillion, or $4,544 billion, including $3.4 trillion in superannuation (more on this later).
To give a context to this number:
- the Gross Domestic Product of Australia is about $2.4 trillion.
- the total market capitalisation of the Australian Securities Exchange is also about $2.4 trillion.
With the superannuation industry alone forecast to grow to about $10 trillion by 2040, and many large companies leaving the listed arena, investors will need to look to offshore and private assets increasingly over time. There will be too much money chasing domestic equities.
3. Superannuation funds
The latest Australian Taxation Office data for June 2022 shows industry funds and SMSFs have streaked away from retail funds, which are in decline.
Total superannuation assets by type of fund, 2017 to 2022
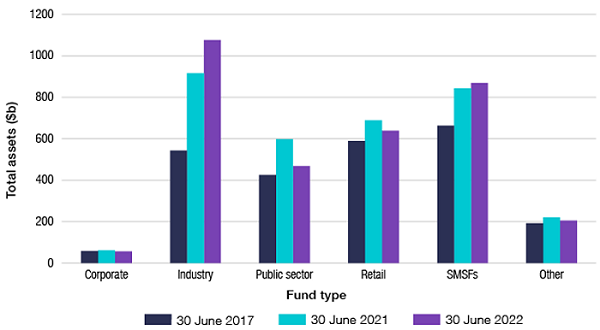
Source: ATO
4. Industry and retail super
The Australian Prudential Regulation Authority (APRA) produces Annual Fund Level Superannuation Statistics, and The Conexus Institute has cleaned up the data, eliminating duplications and clarifying interpretations where possible. The data refers only to industry and retail funds and not corporate funds and SMSFs.
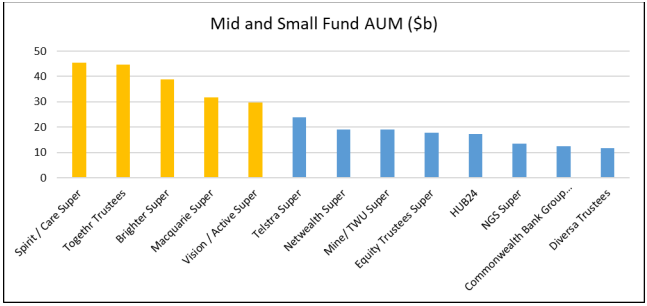
The first chart shows the 14 super funds in the ‘Big Fund Club’ each with assets over $50 billion. They hold about 80% of all the assets in the large super funds. Consolidation of funds is now a feature of the industry, with new deals announced every month. The big transactions are in the ‘mega fund’ category, where AustralianSuper is joined by Australian Retirement Trust (ART) via the merger of Sunsuper and QSuper. Mercer Super has joined the top league after acquiring most of BT’s super business.
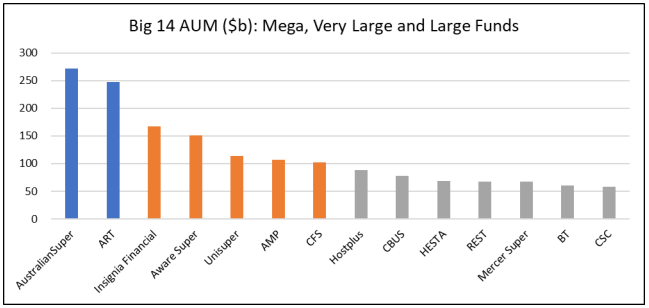
Source: APRA and The Conexus Institute
The remaining 20% of assets are held in another 13 funds with assets over $10 billion, and there are many smaller funds not in this table. So that is 27 super funds with assets varying from $10 billion to close to $300 billion.
Source: APRA and The Conexus Institute
In TAI research on the largest 300 superannuation funds in the world, the data is again dated but useful to see that Australia is better represented in global super and pensions. AustralianSuper was in the Top 20 and 15 Australian super funds made the Top 300. Unlike in Australia where Defined Contributions (DC) dominate, Defined Benefit (DB) funds control 63% of global pension FUM, with DC at 24% and reserve funds at 12% (latest available report). In world rankings in 2021 (before the merger of QSuper and Sunsuper to form ART), in the Top100 were the Future Fund at 26th, Aware Super 46th, and UniSuper 77th.
5. Self-Managed Super Fund (SMSFs)
The media often reports the demise of SMSFs due to large funds and platforms improving their offers, while Exchange Traded Funds (ETFs) and Listed Investment Companies (LICs) provide a wide range of funds which do not require the personal investment choice and control of a member-directed fund. But SMSFs remain highly popular, with over 600,000 funds and 1.1 million members holding almost $900 billion, and their numbers continue to increase. The average SMSF holds almost $1.5 million with the median at $835,000.
A further breakdown on SMSF data includes:
- 66% corporate trustees, 34% individual trustees.
- 55% wholly in accumulation, 36% wholly retirement, 9% mix of both.
- 69% of SMSFs have two members, 24% are single members.
The ATO table below shows the majority of payments from SMSFs are income streams, with members relying on their pensions for regular income.
SMSF benefit payments by type
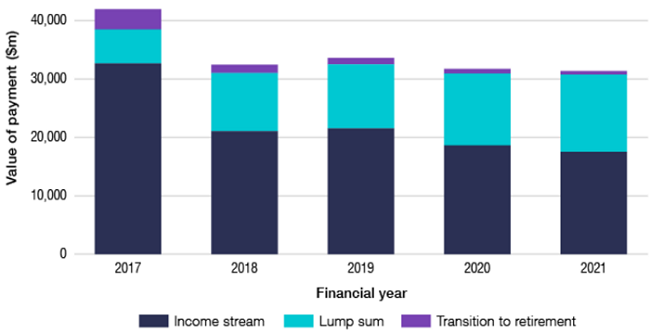
Source: Australian Taxation Office
6. Wraps and platforms
This is where some numbers overlap and should not be added to amounts stated above. For example, platform providers such as Netwealth, HUB24, Macquarie, Fiducian and Colonial First State include super funds and other managed funds in their offers. Platforms benefit from strong engagement with financial advisers who are using the platform structure to manage their businesses and administer their clients. However, most members of the mega industry funds are not introduced via the financial advice process but rather through their occupation.
The Plan for Life ‘Analysis of Wraps, Platforms and Master Trusts’ latest report for December 2022 shows around $1 trillion in various types of ‘master funds’. The funds fell in 2022 due to market falls, some of which have recovered in a stronger 2023. One ongoing trend is that the big funds from Insignia (the merger of MLC and IOOF), BT Financial, Commonwealth/Colonial and AMP are in outflow, while the disruptors in Netwealth, HUB24, Mercer and Praemium are well and truly part of the main game.
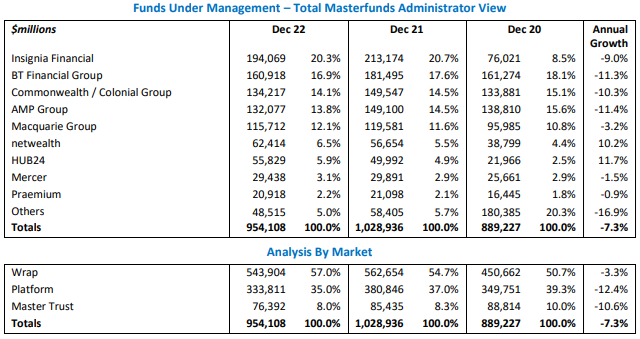
Source: Plan for Life
Another of the Conexus slides taken from APRA data shows the super fund versions of these newer platforms are also attracting large inflows. While AustralianSuper continues to thrive on the back of good performance and massive member reach, and large funds such as ART, Hostplus and Unisuper are doing well, HUB24 and Netwealth are making inroads.
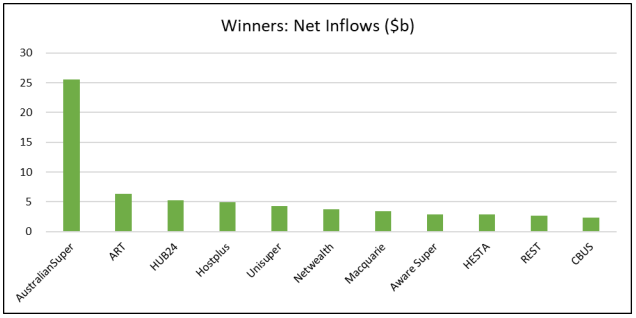
Source: APRA and The Conexus Institute
7. Listed funds (ETFs, LICs, property, infrastructure)
According to the latest ASX Report, there were 437 listed funds comprising Exchange Traded Funds (ETFs), Listed Investment Companies (LICs) and Trusts (LITs), property trusts (A-REITs) and infrastructure funds in April 2023, worth about $400 billion.
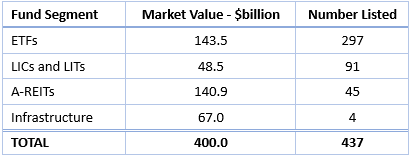
The alternative exchange, Cboe, gives slightly different numbers, but it is evident from both that with the much-publicised ETFs at $144 billion and all listed funds at $400 billion, while the growth is impressive, it’s a small fraction of the managed fund industry.
Conclusion
The billions and trillions can be confusing, and it’s easy to get lost in the numbers of a $200 trillion global industry. Funds management is a massive part of the global economy, influencing governments and companies, and as the world population ages, the numbers are only going one way over time. What comes after trillions?
Graham Hand is Editor-At-Large for Firstlinks. This article is general information and based on an interpretation of latest information.