In Australia, most listed companies have financial years ending in June and they report their full-year results in August. Some companies have December years and they report their half-year results to June in August. There are also a small number of companies with financial years ending in other months – like September (notably ANZ, NAB, Westpac), March (notably Macquarie), July or February, and so their results are not included in the August reporting season wrap-up.
The overall results were poor
Across the 90 companies that reported out of the top 100, aggregate sales revenues grew by 4.6% over the same period last year, from $500 billion to $523 billion. This is no better than the aggregate growth in the local economy (nominal national income).
Aggregate reported profits grew by just +2.5% from $57 billion to $58 billion (excluding Wesfarmer’s $3.3 billion one-off gains from its sales of Coles and three other subsidiaries during the year, and also excluding Woolworths $1.2 billion gain from the sale of petrol stations). If we also exclude the profit growth from the commodities producers driven by windfall global commodities prices, profits for the rest of the market actually fell by 15%.
The main culprits were AMP, Telstra, Suncorp, Crown Casino, Bendigo Bank, Challenger, Ansell, Blackmores, Transurban, Sydney Airport, Aurizon, Qantas, REA, Bluescope, Orora, AfterPay and most of the property trusts. There is always a lot of fiddling and fudging that goes on in profit reports and this year was no exception!
How did the results announcements affect share prices? The first chart shows the results for these 90 companies, with share price growth for August (vertical axis) versus profit growth reported based on full-year results for companies with June financial years and half-year results for companies with December years (horizontal axis).
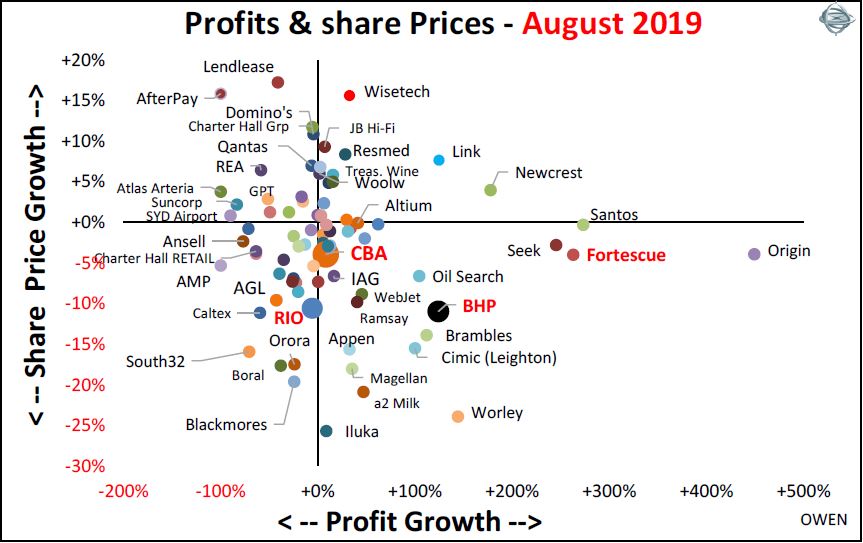
No short-term relationship share prices and profit growth
The chart illustrates that there is no relationship between profit growth and share price growth over short periods because share prices are driven largely by global sentiment. In August, share markets everywhere were hit by Trump’s escalation of his trade wars, currency wars and his criticisms of Fed Chair Jay Powell.
Several companies posted high profit growth, but their share prices fell (lower right segment of the chart) – including Origin, Fortescue, Seek, Worley, BHP, Oil Search, Brambles, Cimic (Leighton), Appen, a2 Milk, Link, Magellan and a host of others. Conversely, many posted profit declines but their share prices rose (upper left segment) – including LendLease, REA, Afterpay, Evolution Mining (gold), Crown Casino, GPT, Suncorp, Qantas and many others.
Aside from macro issues driving share prices, profits are backward-looking but share prices are forward looking. For example, iron ore producers RIO, BHP and Fortescue booked windfall profits from the iron ore surge this year after the mine closures in Brazil reduced global supply, but their share prices were hit when iron ore prices fell back 20% in August. A similar pattern in the oil price affected Origin, Santos, Oil Search, Worley and BHP. Oil prices surged 29% from January to July but fell back 6% in August.
Of course, one month is not a sufficiently long period to assess share price growth and profits, so the second chart shows the same profit growth reported per company, but this time compared to the total share price gains so far in calendar 2019 on the vertical axis.
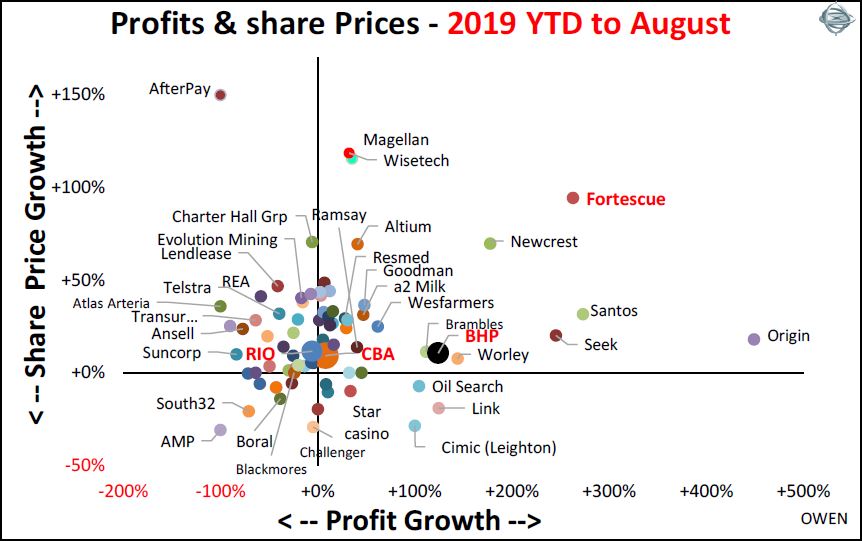
Again, we see that there has been no relationship between profit growth and share prices this year.
Half of the companies posted profit declines (left half of the chart) but the vast majority of share prices have still risen this year (top half of the chart). It was once again due to global macro issues, with share markets everywhere rebounding in 2019 from the late 2018 global sell-off.
Other factors in play
The main driver has been the Fed’s switch from rate cuts last year to rate cuts this year and moves from other central banks toward more monetary stimulus –including two more rate cuts from the RBA. The sugar hits from more stimulus has overcome the negative effects of Trump’s trade wars and their possible impact on slowing economic growth – so far at least.
Another global factor at work has been the decline in bond yields everywhere, which have lifted share prices despite falling profits (upper left segment) in many of the ‘bond proxy’ companies that are often perceived to have relatively ‘safe’ dividends – Telstra, Transurban and the property trusts. (However, just ask any long-suffering Telstra shareholder how ‘safe’ their dividends have been in recent years).
Aside from the commodity stocks (which rise and fall with global commodities prices over which they have no control), the upper right segment of the second chart does highlight some local companies that have real value-adding businesses with rising profits being rewarded with above-market share price rises – including Seek, Magellan, Wisetech, Altium, a2 Milk, Goodman, JB Hi-Fi, Ramsay, ResMed, Cochlear and CSL.
Ashley Owen is Chief Investment Officer at advisory firm Stanford Brown and The Lunar Group. He is also a Director of Third Link Investment Managers, a fund that supports Australian charities. This article is for general information purposes only and does not consider the circumstances of any individual.