Register For Our Mailing List

Register to receive our free weekly newsletter including editorials.

Home / 457

Why gender diversity matters for investors

The debate about the importance of gender diverse leadership has been settled for the most part. Companies, investors and governments have all played a part in boosting the participation of women in the boardroom and on management teams. While progress has been patchy, female representation is higher than ever in companies around the world.

It is now possible to take a detailed look at the impact of this diversity on the way companies operate, and to see if it creates opportunities for investors.

Realindex’s research report, ‘Beyond Lip Service: tracking the impact of the gender diversity gap’, is based on a global data set spanning over 2500 large cap companies, in 30 countries, over more than a decade. It looked beyond easy-to-find board diversity data, to include executive team composition.

The findings of the data are clear: more gender diverse leadership teams deliver better performance outcomes.

Diversity and firm performance

To understand the potential drivers for gender diversity, we looked at firm level attributes of the global large and mid-cap companies using the MSCI ACWI index. The correlation of gender diversity was examined with a variety of firm specific characteristics: the type of indicators that we would look for in our quantitative company analysis process.

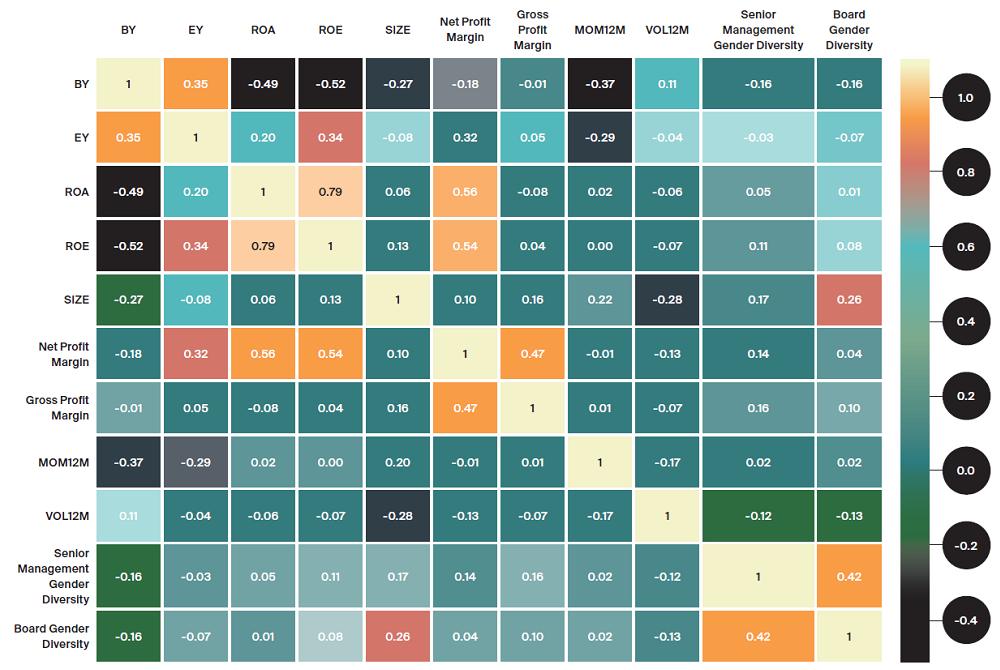
Table 1 reports the average cross-sectional correlations of the firm gender diversity (as captured by the percentage of females in senior management - senior management gender diversity, and the percentage of females on the board – board gender diversity) with a number of firm characteristics. The highest correlation of 1 is represented in the lightest colour, and the lower correlations are shown in the darker colours.

Table 1. Correlation of gender diversity metrics with other firm characteristics MSCI ACWI
Source: FactSet, Realindex, 1 January 2009 – 31 December 2021
Note: For the purposes of this study, we define senior management as the chief executive officer, and their direct reports which would typically include, the chief financial officer, chief operating officer, head of human resources, and chief legal officer.

We found that gender diverse firms (both board and senior management) are typically higher quality firms, where gender diversity has positive correlation with return on assets (ROA), return on equity (ROE), and profit margins (Gross and Net Profit Margins). They also tend to have higher price returns over the previous year (MOM12M) and lower market volatility as evidenced by the negative correlation to 12-month price volatility (VOL12M).

We also found that larger capitalised firms (as captured by Size) tend to have higher diversity, especially in the boardroom, while diverse firms also appear to have high valuation multiples, as seen by the negative correlation between the diversity metrics, and book yield (BY) and earnings yield (EY).

Diversity and future operating performance

The questions that follow are:

  • Has increased female representation made a meaningful impact on firms by improving their operating outcomes?
  • Does senior management gender diversity have a more material impact than diversity in the boardroom?

The central proposition behind this is that diversity in management, and leadership more generally, would lead to greater innovation and, in turn, better financial or operating performance. To answer these questions, we looked at whether there is a link between diversity and profitability / performance of the firm.

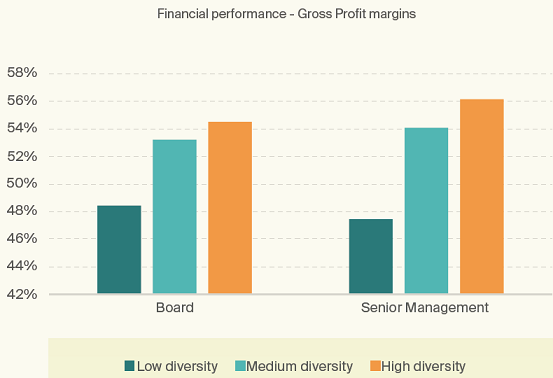
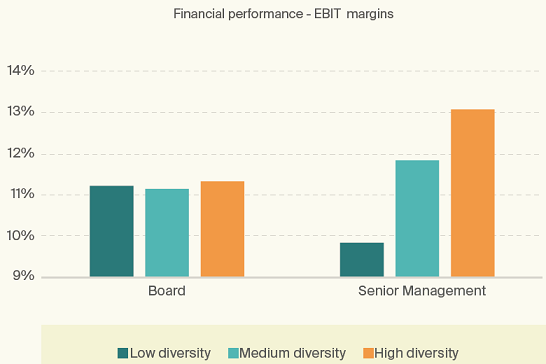
For both board and senior management gender diversity, we analysed profitability metrics commonly investigated in other studies, such as gross and net profit (EBIT) margins. Some interesting results emerge over the sample period, as highlighted in the charts below.

  • In any given year, higher-diversity firms (those approximately in the top one-third of all firms) have about 20% higher margins in the following 12 months than lower-diversity firms (those approximately in the bottom one-third of all firms).
  • In terms of EBIT margins, diversity in senior management is correlated with approximately 30% higher future profit margins, while the diversity at the board level board has less significant effect.

Figures 1-2. Gender diversity and one-year ahead margins
Source: FactSet, Realindex, 1 January 2009 – 31 December 2021

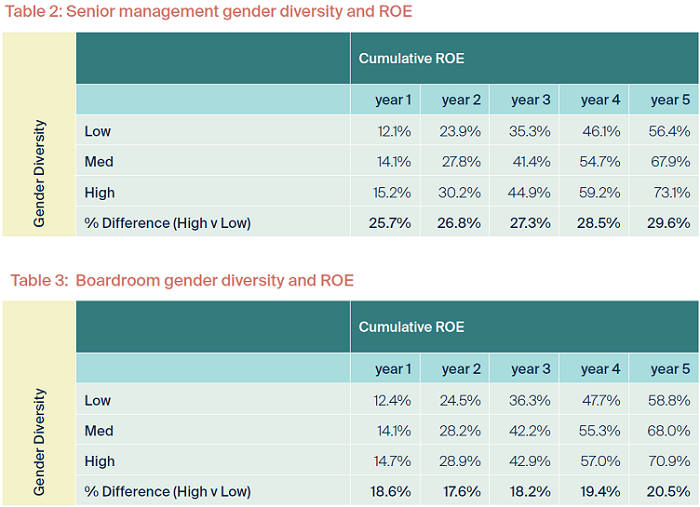
Our analysis then examined future operating performance over multiple years by testing whether the Return on Equity (ROE) of a firm is impacted positively by gender diversity. To do this, we again ranked firms based on their level of senior management or boardroom gender diversity and examined ROE performance over the next 5 years.

The data (in the tables below) shows that for senior management, higher-diversity firms are able to generate cumulative ROEs that are almost 30% higher than lower-diversity firms over a 5-year period. Similarly, for boardroom diversity, cumulative ROE for high boardroom gender diversity firms outstrips firms with low diversity, by 20%.
Source: FactSet, Realindex, 1 January 2009 – 31 December 2021.

Testing the findings

To understand whether these results are robust, we examined whether the relationship remains after controlling for several other common factors, in order to determine if diversity is essentially just picking up other characteristics of the firm that are known to be related to future operating performance.

This analysis confirmed the results shown earlier and revealed several insights:

  • Controlling for sector and region effects, as well as other firm level characteristics, both senior management and board gender diversity are strongly statistically significant in predicting future firm level profitability.
  • For either metric, we can see that firms in the top decile of gender diversity are able to generate approximately an additional 5% of ROE over the next five years, compared to firms in the bottom decile of either diversity metric, after controlling for other effects that drive firm performance.
  • Furthermore, despite their correlation, the presence of both diversity metrics within the same regression does not invalidate the significance of either metric. In fact, we find that firms in both the top decile of senior management and board diversity generate approximately an additional 10% of ROE over the next 5 years compared with firms that have low (bottom decile) diversity in both senior management and the board. This suggests the importance of gender diversity for both boards and senior management teams, as predictors of financial performance.

Overall, the data sends a clear message: companies with a boys’ club approach to leadership are a red flag for investors.

On the other hand, companies that walk the talk on women in leadership roles perform better, potentially making them more attractive investments.

Beyond this, we must not forget that equal representation is the right thing to do. This study has focused on gender diversity in leadership roles, but we acknowledge diversity is multidimensional, such as diversity in skills, experience, and backgrounds. Future work will look to see how we can build a more comprehensive picture in team diversity, thereby gaining greater insights into the management quality or organisational capital of the firm.


Dr Joanna Nash and Dr Ron Guido are Senior Quantitative Portfolio Managers at Realindex Investments, a wholly owned investment management subsidiary of First Sentier Investors, a sponsor of Firstlinks. This article is general information and does not consider the circumstances of any investor.

For a more detailed look at levels of gender diversity in companies by country and sector, read the full report here.

For more articles and papers from First Sentier Investors, please click here.


  •   11 May 2022
  • 6
  •      
  •   
6 Comments
Alan B
May 11, 2022

"...gender diversity (as captured by the percentage of females in senior management - senior management gender diversity, and the percentage of females on the board – board gender diversity) "
This definition assumes that gender diversity is achieved by the highest percentage of females to males. But a 100% female team is not diverse because it includes no males. Gender diversity in corporate leadership should be defined and achived by a balance of males and females reflecting the general population or industry population, or better still the qualified female/male candidates ratio. A 1% or 100% male or female board is anything but gender diverse. A 50% male/female board is gender diverse reflecting the general population ratio, but not necessarily the female/male ratio within the industry, eg a higher such ratio in retailing and lower in mining.

Peter B
May 11, 2022

In my business and board experience, when diversity has been given greater weight than merit, the result has been mediocre.

Scott
May 11, 2022

Berkshire Hathaway is the most successful conglomerate in the world. They have a large executive team (11 men and 4 women) Tesla is the most successful disrupter Their executive team team is (6 men and 2 women) To survive and flourish these companies simply choose the best people. The leadership of these companies is regarded as transformational. Quota advocates need not apply for a job at these companies. The whole gender noise generated by academics is taking this country down to lower levels.

Steve
May 11, 2022

Hmmm. Don't take this as anti-diversity, I have for years wondered if the pitiful outcomes from BHP's board over a very long stretch was a classic old boys club problem, so anything that can increase a boards ability to genuinely assess risk and potential I'm all for it. I bet I could pick just about any other attribute and get a correlation of at least 0.1-0.2 with financial metrics (age of board members; education level; left or right handed).


All this data tells us is that gender diversity is AT BEST a very weak predictor of financial performance. The phrase "strongly statistically significant" as used here seems a stretch. For those not up to speed with correlation coefficients, a value of 1 means every result is perfectly predicted (ie correlated) by the model being used. A value of -1 means the result is also perfect but inverse (ie instead of a better outcome, it is a worse outcome). A value of zero means absolutely no correlation at all - totally random. The values quoted here are extremely low for the role of gender diversity, the highest are not surprisingly between a gender diverse board and a gender diverse management, also with the size of the company (probably due to market pressure to increase representation being greater at larger public companies). The actual financial outcomes have extremely weak correlations. None are greater than 0.17 and quite a few are <0.05. These are pitiful correlations. When the correlation coefficient is say 0.04 it means the model (ie diversity) can only explain 4% of the changes in the attribute (eg net profit margin). 96% of the outcomes aren't explained by the model; some other factor(s) are at play but are somehow ignored. Ask a drug manufacturer how much weight they would place in numbers like this! 

C
May 14, 2022

People should be chosen or promoted based on merit alone regardless of gender or race and certainly not just for the sake of achieving KPI diversity targets.

Rod
May 14, 2022

Worth noting that the results are, in any case, a description of a correlation - not causation. It could be that success leads to more concentration on diversity. Or that some other factor links the two.


Leave a Comment:

RELATED ARTICLES

Why investment stewardship matters for long-term investors

Bigger companies have more females on their boards

Are Australian bank boards fit for purpose?

banner

Most viewed in recent weeks

Does your will qualify for the discretionary testamentary trust exemption?

Treasury has confirmed the exemption many families were hoping for. But buried in the fine print are two conditions that could leave some wills on the wrong side of the exemption, despite years of careful planning.

Are you making these SMSF mistakes?

After four decades advising investors, there are a few common mistakes I've seen SMSF investors make. From holding too much cash and chasing yield to overtrading and trusting tips. Are these errors costing you?

Lithium's latest drop and what it means for ASX investors

Lithium's latest sell-off has punished ASX miners as prices remain hostage to shifting expectations. The key challenge is navigating a market prone to extreme volatility despite a strong case for the long-term demand outlook.

Retirement spending is not one-size-fits-all

New data challenges the idea that Australians are underspending their super. The bigger issue may be helping retirees navigate complexity, make confident decisions and use their savings to support security, wellbeing and choice.

Why have Australian living standards 'fallen' and how do we fix it?

For the last few years there has been much talk of a 'cost-of-living' crisis in Australia and of 'falling living standards'. Lately this has flared up again with the pickup in inflation resulting in a renewed fall in real wages.

The missing link in the CGT debate

A little-noticed consequence of Labor’s tax changes could have implications well beyond investors’ tax bills. The issue raises bigger questions about incentives, capital allocation and the drivers of long-term economic growth.

Latest Updates

Planning

Testamentary trusts have secured the CGT exemption

Treasury’s latest CGT reform draft delivers a win for testamentary trusts and deceased estates, exempting estate-derived gains from the 30% floor. However, questions on death and divorce rollovers remain unresolved.

Superannuation

How much super should you have?

Average super balances are one of the most misleading benchmarks. They ignore your goals, spending and future needs, creating a false sense of security. Here is how I calculate exactly where I need to be at every decade.

Retirement

Retiring from work is easy, retiring into life is harder

Most people spend decades planning how to retire. Far fewer plan for what comes next. The biggest retirement challenge isn't always financial, and it often catches even the most prepared retirees completely off guard.

Shares

Right asset class, wrong index: the trap in Australian small caps

Most Australian portfolios are concentrated in large caps, with relatively little exposure to smaller companies. But what if the biggest risk isn't the economy, interest rates or valuations? For many, the risk is hidden in plain sight.

Property

Are these assets the missing piece in Australian portfolios?

Many investors remain concentrated in shares, cash and property. Despite their popularity among institutional investors, real assets remain underrepresented in many SMSF portfolios. Could they be the missing piece?

Investment strategies

The biggest risk that buy-and-hold investors ignore

Investors spend decades learning how to stay invested, yet few have a plan for getting out. When a financial goal has a hard deadline, a worked example shows why a fixed derisking schedule should outrank buy-and-hold discipline.

Investment strategies

How passive investing is driving the decline of active fund alpha

Why have active managers struggled as passive investing has surged? Research suggests that flows into index funds and ETFs are creating structural headwinds, penalising the stock-picking strategies that once generated alpha.

Sponsors

Alliances

  • ASA-Logo-RGB-ActiveGreen-web.png

© 2026 Morningstar, Inc. All rights reserved.

Disclaimer
The data, research and opinions provided here are for information purposes; are not an offer to buy or sell a security; and are not warranted to be correct, complete or accurate. Morningstar, its affiliates, and third-party content providers are not responsible for any investment decisions, damages or losses resulting from, or related to, the data and analyses or their use. To the extent any content is general advice, it has been prepared for clients of Morningstar Australasia Pty Ltd (ABN: 95 090 665 544, AFSL: 240892), without reference to your financial objectives, situation or needs. For more information refer to our Financial Services Guide. You should consider the advice in light of these matters and if applicable, the relevant Product Disclosure Statement before making any decision to invest. Past performance does not necessarily indicate a financial product’s future performance. To obtain advice tailored to your situation, contact a professional financial adviser. Articles are current as at date of publication.
This website contains information and opinions provided by third parties. Inclusion of this information does not necessarily represent Morningstar’s positions, strategies or opinions and should not be considered an endorsement by Morningstar.