Australia has more listed companies per head of population than just about any other country on earth – and many times more than the US. Why?
Is it because we have many times more viable businesses opportunities to pursue? Or is it because we have the wiliest stock promoters and spruikers, and we are the biggest gamblers in the world?
Actually, it is both!
Aussies leading the world
Australia has 0.3% of the world’s population, and 1.5% of the world’s land surface area, but it has 4.5% of the world ‘s stock exchange listed companies. This is some 13x the world average number of listed companies per head of population, and five times more than the USA.
Since the earliest days of organised stock exchanges in Australia’s fledgling coastal cities and scattered across a host of remote, dusty mining towns, Australians have always led the world in investing their hard-earned cash in speculative mining ventures. To this day, Australia (along with that other wild west mining frontier land, Canada) continues to have the largest number of listed companies per head of population in the world, many times more than the US, UK and other ‘developed’ or ‘rich’ countries.
The left chart shows the number of domestic listed companies in the 80-odd countries in the world with recognised stock exchanges. Countries are ranked in order of population – from China at the top, to Bermuda at the bottom.
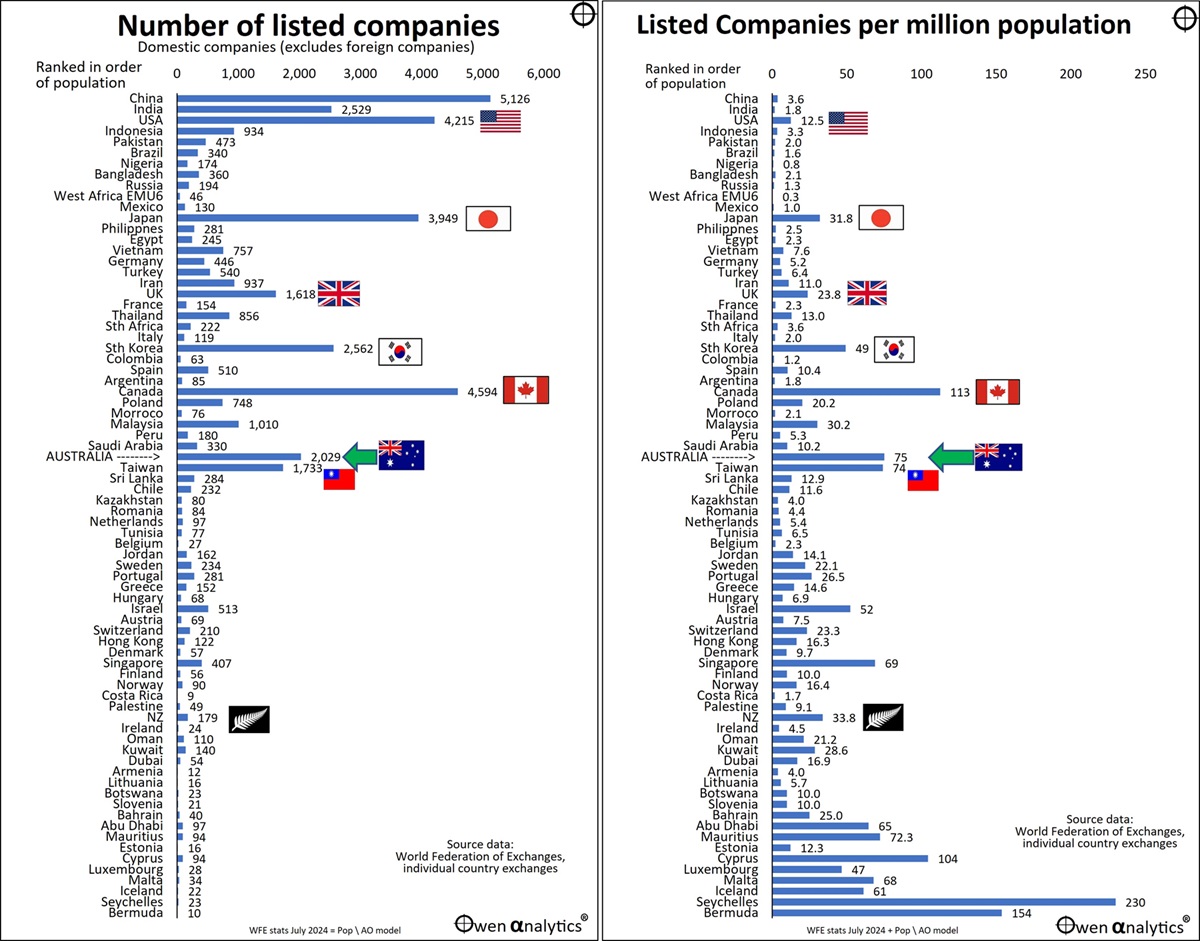
For this purpose I exclude foreign listed companies in order to eliminate double-counting (eg ASX-listed NZ-based companies like Xero, a2Milk, Fisher & Paykel Healthcare are included in the numbers for their home exchange in NZ, but not Australia). Likewise for foreign listings on other exchanges.
In total, there are more than 55,000 companies listed on stock exchanges around the world, but only around 50,000 companies excluding multiple foreign listings. Also excluded are listed funds (unit trusts) and ETFs.
Listed companies per capita
The right chart shows the number of domestic listed companies per million population in each country. Aside from some small tax havens down near the bottom of the chart, Canada is the leader, with 113 listed companies per million population. Australia is not far behind with 75 listed companies per million people.
Other countries with relatively high numbers of listed companies per capita are technology hubs Taiwan, South Korea, Japan, and Israel.
The US market has a wide diversity of industries and has been the dominant technology and innovation hub of the world for the past century, but it has only a fraction of the number of listed companies per capita than Canada or Australia. The number of US listed companies has been declining in recent decades, despite the huge tech booms in the 1990s and 2000s.
The number of listed companies per capita in Australia have been relatively stable, and several times US levels, especially since the late 1960s mining boom. In Europe the numbers of listed companies per capita are very low indeed, probably because of the heavy state involvement and regulation of business across Europe.
Mining speculators’ paradise
Australia and Canada are the stars – but why? They are not technology innovation hubs – in fact, the exact opposite. The stock markets of both countries lack the broad diversity of industries of the US market. Australian and Canadian stock markets are both dominated by a very small number of large banks and miners.
In the case of Australia and Canada, although each has more than 2,000 and 4,000 listed companies respectively, the vast majority of these are tiny revenue-less, profitless, wannabe mining explorers with little more than a map, a compass, and the promoters’ (mostly unjustified) dream of striking it rich. This has been the case since the earliest days of share trading in remote mining settlements.
The vast majority of tiny explorers will disappear worthless when they run out of money before finding anything useful to dig up. They will be replaced by the next round of tiny explorers that will also disappear worthless when they, too, run of money. There is always a next round of starry-eyed investors willing to throw money at dreams of hitting the jackpot in some faraway patch of dirt just waiting to be discovered.
More companies, not higher returns
It should be noted that simply having more listed companies to invest in does not lead or contribute to higher share market returns. Australia and Canada are similar to the US and all other stock markets in that the vast bulk of wealth created by the share market as a whole has come from a tiny handful of companies.
One of the main downsides for Aussie and Canadian investors has been that the huge number of cashless, profitless, speculative ventures tend to divert investors’ attention from the real generators of wealth.
It is very hard to resist the lure of hitting the jackpot by discovering the next Chalice Mining or Pilbara Minerals or Lynas.
Vast unexplored territories
There are probably two main reasons for Australia and Canada having much higher numbers of listed companies per capita than the rest of the world. The first is that both countries are vast, sparsely populated, frontier territories filled with an extraordinarily wide range of mineral resources just waiting to be explored and exploited.
Mining requires capital.
Aside from the initial alluvial gold fields that were exhausted quickly by hand at minimal cost, exploration and development of mines requires large pools of capital that generally require the collection of money from hundreds or thousands of willing investors. This requires corporate structures to protect investor rights, and processes to enable the secondary buying and selling of shares, which in turn requires brokers, lawyers, accountants, auditors, and recordkeepers – ie stock exchanges.
Highest income and wealth per capita
A second likely reason for the large numbers of speculative mining ventures in Australia and Canada, is that the combination of high-value resource exports plus sparse populations, has produced very high levels of individual wealth and incomes in both countries.
In many or most resource-rich countries (like Venezuela, Nigeria and dozens of other countries), much or most of the wealth has been, and still is, siphoned off by the rulers and their cronies, resulting in very low incomes and wealth for the great bulk of the population. In contrast, Australia and Canada have had relatively stable, representative political systems, and relatively low levels of inequality of incomes and wealth.
As a result of speculative mining riches (as well as from wool during the first 150 years), Australians have enjoyed the highest or near highest median income and wealth per capita in the world since the late-1800s, much higher than the US. This is still the case today.
Chronic gamblers
Australians have long been the biggest gamblers in the world per capita (eg see Productivity Commission report). This may be one of the reasons for our love of speculative mining stocks. Or is it the other way around? Are we a nation of mad gamblers today because of our history of speculative mining riches?
Meanwhile, time to get back to finding the next winner!
Ashley Owen, CFA is Founder and Principal of OwenAnalytics. Ashley is a well-known Australian market commentator with over 40 years’ experience. This article is for general information purposes only and does not consider the circumstances of any individual. You can subscribe to OwenAnalytics Newsletter here. Original article is here: Australia: Most listed stocks per capita, and biggest gamblers in the world - Is there a link?.