Register For Our Mailing List

Register to receive our free weekly newsletter including editorials.

Home / 276

Changing landscape of US large and mid caps

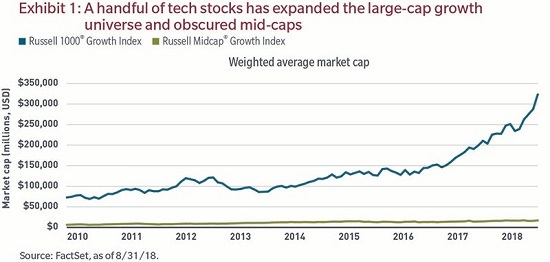
Historically, an allocation to the US large cap growth category of the equity asset class, as represented by the Russell 1000® Growth Index, has presented investors with a reasonable opportunity to gain exposure to mid cap stocks. For this analysis, we define US mid caps as companies with a market capitalisation between $2 billion and $25 billion1. The advantage of this inefficiency within the asset class is that it may help to diversify a portfolio, at least from a market capitalisation standpoint. However, due primarily to the strong performance of a handful of technology stocks (and their ensuing increase in market capitalisation) within the Russell 1000® Growth Index, today’s large-cap growth investor may be less able to gain mid cap exposure through the traditional large cap growth allocation (as shown in Exhibit 1).

The increasing dominance of large caps

In our view, the dominance of the most influential large cap stocks can be better appreciated when viewed from the perspective of market-capitalisation buckets, as illustrated in Exhibit 2. Exposure to mid cap stocks in the Russell 1000® Growth Index has declined from 39% of that index in 2010 to just 14% as of 31 August 2018. Also worth noting is where this percentage change was reallocated. We have observed a significant increase in stocks with a market capitalisation greater than $300 billion in the index.

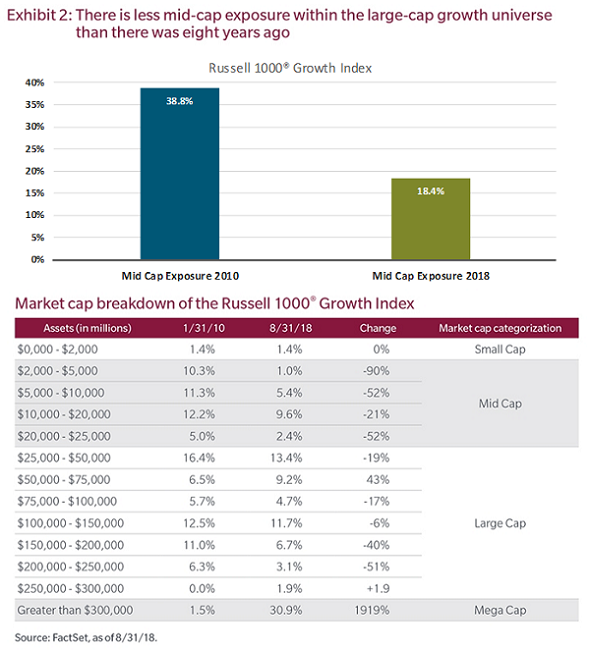
This one-dimensional shift in the market cap exposures has added an additional layer of concentration risk where over 30% of the Russell 1000® Growth Index is focused on those companies with a market valuation of over $300 billion.

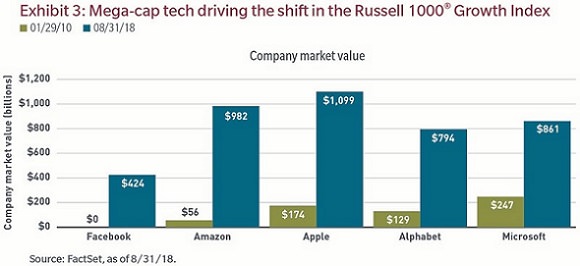
Exhibit 3 puts it in perspective. In 2010, Facebook was not even a publicly traded company (IPO: May 2012), but it’s currently the sixth-largest company in the index, behind only Apple, Alphabet, Amazon, Microsoft and Berkshire Hathaway.

Dedicated allocation to mid caps

While the market caps for the largest growth companies have accelerated dramatically since mid-2016, outpacing mid caps, how this trend is likely to progress is uncertain. However, an allocation to large cap growth today provides far less exposure to companies further down the capitalisation spectrum. A dedicated allocation to mid cap growth may prove a key component of a comprehensive asset allocation framework moving forward.

In any market environment, we strongly believe that investors should stay diversified across a variety of asset classes. By constructing your portfolio with the awareness of how these weights shift over time, you can help ensure that your portfolio is properly diversified and that your financial strategy supports your long-term goals, time horizon and tolerance for risk. Diversification does not guarantee a profit or protect against loss.


Nick Paul is Institutional Equity Portfolio Manager at MFS Investment Management, a sponsor of Cuffelinks. The views expressed in this commentary are those of the author and are subject to change at any time. These views should not be relied upon as investment advice, as securities recommendations, or as an indication of trading intent on behalf of any investment product.

For more articles and papers from MFS Investment Management, please click here.


Endnotes

1 Companies with a market capitalization between $2 billion and $25 billion account for 80% of the constituents in the Russell Midcap® Growth Index, as of 8/31/18.

The Russell 1000 Growth Index® measures US large-cap growth stocks.

The Russell Midcap Growth Index® measures U.S. mid-cap growth stocks. It is not possible to invest directly in an index. Past performance is no guarantee of future results.

Frank Russell Company (“Russell”) is the source and owner of the trademarks, service marks and copyrights related to the Russell Indexes. Russell® is a trademark of Frank Russell Company. Neither Russell nor its licensors accept any liability for any errors or omissions in the Russell Indexes and/or Russell ratings or underlying data and no party may rely on any Russell Indexes and/ or Russell ratings and/or underlying data contained in this communication. No further distribution of Russell Data is permitted without Russell’s express written consent. Russell does not promote, sponsor or endorse the content of this communication.


Leave a Comment:

RELATED ARTICLES

Is FOMO overruling investment basics?

Why stock prices are a distraction

Best-in-class, ‘pure-play’ companies give clearer focus

banner

Most viewed in recent weeks

7 examples of how the new super tax will be calculated

You've no doubt heard about Division 296. These case studies show what people at various levels above the $3 million threshold might need to pay the ATO, with examples ranging from under $500 to more than $35,000.

The revolt against Baby Boomer wealth

The $3m super tax could be put down to the Government needing money and the wealthy being easy targets. It’s deeper than that though and this looks at the factors behind the policy and why more taxes on the wealthy are coming.

Meg on SMSFs: Withdrawing assets ahead of the $3m super tax

The super tax has caused an almighty scuffle, but for SMSFs impacted by the proposed tax, a big question remains: what should they do now? Here are ideas for those wanting to withdraw money from their SMSF.

Are franking credits hurting Australia’s economy?

Business investment and per capita GDP have languished over the past decade and the Labor Government is conducting inquiries to find out why. Franking credits should be part of the debate about our stalling economy.

Here's what should replace the $3 million super tax

With Div. 296 looming, is there a smarter way to tax superannuation? This proposes a fairer, income-linked alternative that respects compounding, ensures predictability, and avoids taxing unrealised capital gains. 

The huge cost of super tax concessions

The current net annual cost of superannuation tax subsidies is around $40 billion, growing to more than $110 billion by 2060. These subsidies have always been bad policy, representing a waste of taxpayers' money.

Latest Updates

Superannuation

Here's what should replace the $3 million super tax

With Div. 296 looming, is there a smarter way to tax superannuation? This proposes a fairer, income-linked alternative that respects compounding, ensures predictability, and avoids taxing unrealised capital gains. 

Superannuation

Less than 1% of wealthy families will struggle to pay super tax: study

An ANU study has found that families with at least one super balance over $3 million have average wealth exceeding $19 million - suggesting most are well placed to absorb taxes on unrealised capital gains.   

Superannuation

Are SMSFs getting too much of a free ride?

SMSFs have managed to match, or even outperform, larger super funds despite adopting more conservative investment strategies. This looks at how they've done it - and the potential policy implications.  

Property

A developer's take on Australia's housing issues

Stockland’s development chief discusses supply constraints, government initiatives and the impact of Japanese-owned homebuilders on the industry. He also talks of green shoots in a troubled property market.

Economy

Lessons from 100 years of growing US debt

As the US debt ceiling looms, the usual warnings about a potential crash in bond and equity markets have started to appear. Investors can take confidence from history but should keep an eye on two main indicators.

Investment strategies

Investors might be paying too much for familiarity

US mega-cap tech stocks have dominated recent returns - but is familiarity distorting judgement? Like the Monty Hall problem, investing success often comes from switching when it feels hardest to do so.

Latest from Morningstar

A winning investment strategy sitting right under your nose

How does a strategy built around systematically buying-and-holding a basket of the market's biggest losers perform? It turns out pretty well, so why don't more investors do it?

Sponsors

Alliances

© 2025 Morningstar, Inc. All rights reserved.

Disclaimer
The data, research and opinions provided here are for information purposes; are not an offer to buy or sell a security; and are not warranted to be correct, complete or accurate. Morningstar, its affiliates, and third-party content providers are not responsible for any investment decisions, damages or losses resulting from, or related to, the data and analyses or their use. To the extent any content is general advice, it has been prepared for clients of Morningstar Australasia Pty Ltd (ABN: 95 090 665 544, AFSL: 240892), without reference to your financial objectives, situation or needs. For more information refer to our Financial Services Guide. You should consider the advice in light of these matters and if applicable, the relevant Product Disclosure Statement before making any decision to invest. Past performance does not necessarily indicate a financial product’s future performance. To obtain advice tailored to your situation, contact a professional financial adviser. Articles are current as at date of publication.
This website contains information and opinions provided by third parties. Inclusion of this information does not necessarily represent Morningstar’s positions, strategies or opinions and should not be considered an endorsement by Morningstar.