Register For Our Mailing List

Register to receive our free weekly newsletter including editorials.

Home / 211

Clear winner and loser in 2017/2018 survey

Over 400 readers completed the short survey on expectations for market returns in this new financial year, and the results suggest optimism for overall share market performance.

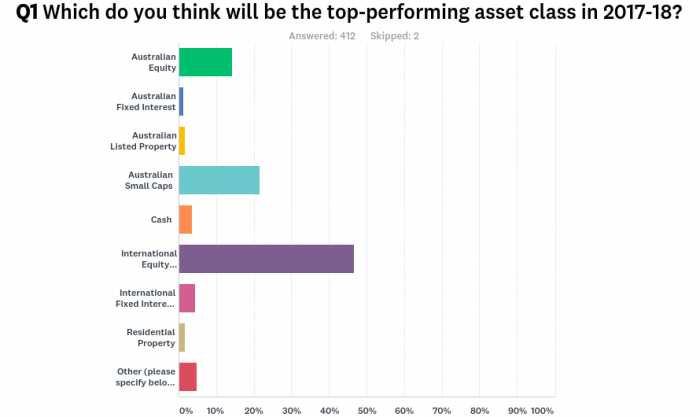
Winner of the expected best-performer category

Unhedged international equities (46% of votes)

Equities received strong support, with unhedged global shares (46%), Australian small caps (22%) and Australian equities (15%) adding up to 83% of votes. There was little support for fixed interest, and with cash at only 4% of votes, few investors see a market rout.

Particularly notable is that international equities have come first in four of the previous five financial years, so there’s either little support for ‘reverting to the mean’, or people are extrapolating from recent performance. How much does the concentration in Australia’s market among banks, miners and retailers play a role?

Only 2% expect residential property to be the best, but as in all years, that’s where most of the investment dollars will go.

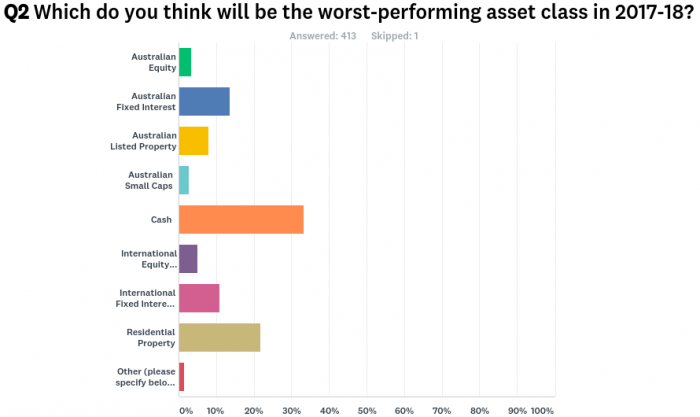
Winner (or loser) of the expected worst-performer category

Cash (33% of votes)

Expectations for the worst performer were somewhat more balanced, with cash and fixed interest adding up to 57% of nominations. Taking a look at the Morningstar numbers for each financial year since 1998, cash has only come bottom twice. There are usually one or two other asset classes that put in a bad year and underperform the defensive characteristics of cash. Last year, cash outperformed listed property and fixed interest.

A healthy 22% expect residential property to perform worst, which is a decent vote for the market finally losing its head of steam (in Sydney and Melbourne, at least).

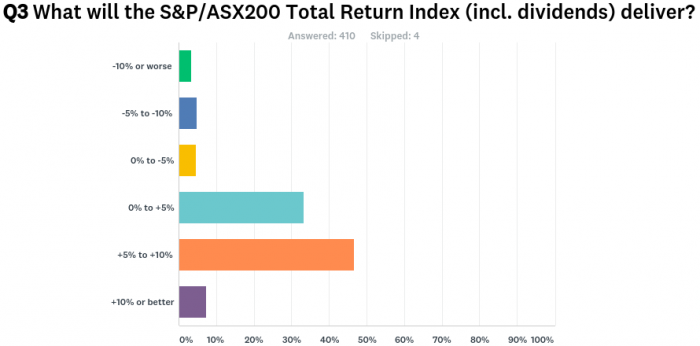
Most nominated range for S&P/ASX200 Total Return Index

+5% to +10% (47% of votes)

A strong 87% of votes placed the Australian index in the range of 0% to 10%, with most above +5%. Given the US market is at all-time highs and Australian and global valuations look stretched, and with US rates rising, this is an optimistic note for steady performance. There was stronger support for +10% and better (7.5%) than a bad result of -10% or worse (only 3%).

We will report on the results of these predictions at the end of 2017/2018.

  •   20 July 2017
  • 4
  •      
  •   
4 Comments
Paul
July 20, 2017

Graham, on your newsletter talking about ripping off existing customers, my bank offers walk in or “blow in” new customers 3% pa on their Maxi Savings account. Despite being a loyal customer over many years, they could only get me up to 2.7% after first stating that 2.55% was the rate for “high worth” existing customers. Bring on the Royal Commission!

Andre Lavoipierre
July 20, 2017

Graham, You state that last year cash outperformed listed property and fixed interest. Also it appears that respondents to the survey have fixed interest as third worst performing asset class in 2017-18. I think your next survey should split fixed interest into fixed and floating because the floating rate securities have done very well over the past year eg Esltree Funds Management, who invest in listed convertible preference shares and subordinated notes (commonly known as hybrids) returned 13.7%...not a bad return considering _the volatility is only circa 22% of its comparable equities.

Kenneth Maurice Ellis
July 20, 2017

Why are so many wanting to reduce the profit of our banks when the vast majority of all superannuation funds hove some exposure to them. Is it a desire to have a lower value for our superannuation? or just that people like bitching?

Cheers, Ken Ellis

Kevin
July 22, 2017

Hiya Kenneth.

I think it is human nature to bitch,and accept that if everybody repeats something then it must be true, and great wisdom.

I keep annual reports.Looking at WBC and ANZ around 1991 when they were suffering, net interest margins were around the 4.5% mark.When they came back to profit most years the profit as a %age of assets is 1%.That is almost constant from 1991 until now.Net margins have fallen to around the 2% mark (less for NAB).Yet since then politicians,crowds,experts, all repeating the same thing, huge profits (where),how could it not be true.

CBA funds me so in 1996 if my memory is correct they almost had 100 billion in gross assets.Net profit of almost $1 billion.Net margins of around 3.8 or3. 9 %.They have been so constant in net profit,always 1% or 1.1% of gross assets.Net margins down to around 2.07%.

I would think shortly CBA will have gross assets of $1 trillion,which will produce net profit of $10 billion.No doubt politicians will have their crocodile tears,vote for me and I will do something about these huge profits.I wish they would explain how 1% is a huge profit margin after taxes and expenses


Leave a Comment:

RELATED ARTICLES

The 60:40 portfolio ... if no longer appropriate, then what is?

Diversification is the foundation of a solid portfolio

banner

Most viewed in recent weeks

Building a lazy ETF portfolio in 2026

What are the best ways to build a simple portfolio from scratch? I’ve addressed this issue before but think it’s worth revisiting given markets and the world have since changed, throwing up new challenges and things to consider.

Get set for a bumpy 2026

At this time last year, I forecast that 2025 would likely be a positive year given strong economic prospects and disinflation. The outlook for this year is less clear cut and here is what investors should do.

Meg on SMSFs: First glimpse of revised Division 296 tax

Treasury has released draft legislation for a new version of the controversial $3 million super tax. It's a significant improvement on the original proposal but there are some stings in the tail.

Ray Dalio on 2025’s real story, Trump, and what’s next

The renowned investor says 2025’s real story wasn’t AI or US stocks but the shift away from American assets and a collapse in the value of money. And he outlines how to best position portfolios for what’s ahead.

10 fearless forecasts for 2026

The predictions include dividends will outstrip growth as a source of Australian equity returns, US market performance will be underwhelming, while US government bonds will beat gold.

13 million spare bedrooms: Rethinking Australia’s housing shortfall

We don’t have a housing shortage; we have housing misallocation. This explores why so many bedrooms go unused, what’s been tried before, and five things to unlock housing capacity – no new building required.

Latest Updates

3 ways to fix Australia’s affordability crisis

Our cost-of-living pressures go beyond the RBA: surging house prices, excessive migration, and expanding government programs, including the NDIS, are fuelling inflation, demanding bold, structural solutions.

Superannuation

The Division 296 tax is still a quasi-wealth tax

The latest draft legislation may be an improvement but it still has the whiff of a wealth tax about it. The question remains whether a golden opportunity for simpler and fairer super tax reform has been missed.

Superannuation

Is it really ‘your’ super fund?

Your super isn’t a bank account you own; it’s a trust you merely benefit from. So why would the Division 296 tax you personally on assets, income and gains you legally don’t own?

Shares

Inflation is the biggest destroyer of wealth

Inflation consistently undermines wealth, even in low-inflation environments. Whether or not it returns to target, investors must protect portfolios from its compounding impact on future living standards.

Shares

Picking the next sector winner

Global equity markets have experienced stellar returns in 2024 and 2025 led, in large part, by the boom in AI. Which sector could be the next star in global markets? This names three future winners.

Infrastructure

What investors should expect when investing in infrastructure: yield

The case for listed infrastructure is built on stable earnings and cash flows, which have sustained 4% dividend yields across cycles and supported consistent, inflation-linked long-term returns.

Investment strategies

Valuing AI: Extreme bubble, new golden era, or both

The US stock market sits in prolonged bubble territory, driven by AI enthusiasm. History suggests eventual mean reversion, reminding investors to weigh potential risks against current market optimism.

Sponsors

Alliances

© 2026 Morningstar, Inc. All rights reserved.

Disclaimer
The data, research and opinions provided here are for information purposes; are not an offer to buy or sell a security; and are not warranted to be correct, complete or accurate. Morningstar, its affiliates, and third-party content providers are not responsible for any investment decisions, damages or losses resulting from, or related to, the data and analyses or their use. To the extent any content is general advice, it has been prepared for clients of Morningstar Australasia Pty Ltd (ABN: 95 090 665 544, AFSL: 240892), without reference to your financial objectives, situation or needs. For more information refer to our Financial Services Guide. You should consider the advice in light of these matters and if applicable, the relevant Product Disclosure Statement before making any decision to invest. Past performance does not necessarily indicate a financial product’s future performance. To obtain advice tailored to your situation, contact a professional financial adviser. Articles are current as at date of publication.
This website contains information and opinions provided by third parties. Inclusion of this information does not necessarily represent Morningstar’s positions, strategies or opinions and should not be considered an endorsement by Morningstar.