Register For Our Mailing List

Register to receive our free weekly newsletter including editorials.

Home / 136

Global index flaw has flow-on consequences

It’s not universally known (but nor is it a secret) that MSCI, the major provider of performance indices on global equity markets, understates the performance of its global indices calculated for Australian investors. On the surface you may think this doesn’t mean much, but there are actually many flow-on effects worth tens of millions of dollars.

Index calculation trickier than it seems

The job of an index calculation group is much more complex than you think. At first blush, it may seem that all they do is take the index weightings, and account for dividends, corporate actions and stock movements to get the total performance. Well, not really, especially when it comes to global indices. When one invests offshore there are a variety of taxes such as withholding taxes and stamp duties which must be paid on dividends earned in different countries.

Where it gets really complex is that different countries have different tax treaties between them which need to be accounted for. It can also depend on whether they apply to a personal or institutional investor. Should an index provider like MSCI calculate a separate index for the performance of a global equities index based on the experience of different investor types in each country around the world? They don’t because there would be many indices to calculate. Rather they calculate the performance using the most conservative set of assumptions. Of all possible combinations, they select the one that has the highest tax / lowest performance. Because Australia has many double tax treaties in place, the performance experience of an Australian investor using a passive approach would be higher (ignoring transaction and management fees).

Understatement is a significant issue

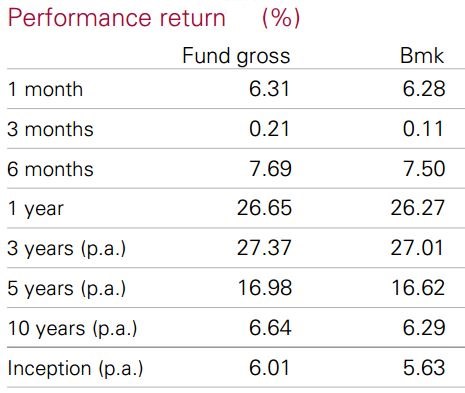
The performance understatement has averaged between 30bp to 40bp per annum. The understatement is larger when dividend yields are high, making it an even larger problem for indices on higher-yielding sectors such as REITS and infrastructure. The simple way to provide some evidence is to look at the reported gross performance of index funds against the index.

Below I have snipped the gross performance numbers for Vanguard’s International Shares Index Fund (refer to Vanguard’s website for appropriate performance disclaimers etc.). We can see that the fund has consistently outperformed the benchmark, yet it is being run in a passive manner. (The fund is the MSCI World ex-Australia Index in AUD, and Bmk means benchmark).
Is this valuable information or just trivia?

Consider the ways we use such performance data:

Assessing the relative merits of active versus passive investment

Global equities make up a large part of many portfolios. Across institutional super funds, the average allocation is around 20% worth up to $300 billion of capital. The debate about active or passive investing in global equities is fierce and the numbers look tight: there appears to be little outperformance on average. However, once we account for the data issue, the average global equities fund underperforms (because the index is doing better than we think). Assuming an average active management fee of 50bp (above index fees) for institutional investors, then up to $1.5 billion p.a. is the possible fee pool being spent on active global equities. How well informed and how efficient is this decision?

Calculation of performance fees or bonuses based on outperformance

Some funds charge performance fees, commonly relative to the performance of the benchmark. A fund that mirrors the holdings of the index is likely to outperform the index by say 30bp. If we assume a performance fee of 10% above index, then this results in 3bp of performance fees. This isn’t a big number in the context of an individual, where many other factors will impact more greatly upon their performance. However, the system wide costs can be large, simply because the assets under management can be so large. A fund with assets of $10 billion will unfairly earn an extra $3 million p.a. in performance fees.

Furthermore, investment staff at super funds are often paid a bonus based on performance relative to benchmark. They too participate in this free ride. There can be gaming issues if the quirk is known by some but not by all within a fund. For instance, the portfolio manager in charge of selecting global equity funds, if solely aware of the quirk, may just invest passively, outperform the benchmark and receive a handsome bonus which is undeserved, at the expense of the member (directly for an industry super fund and less directly for a retail fund).

Judging different products managed by the same fund manager.

Some global equity managers offer different risk versions of their products. It is common to see the low risk product has a higher information ratio (outperformance divided by tracking error) than the higher risk version. A common explanation is that the lower risk version is more efficiently constructed. However, it is also true that the 30bp to 40bp pick-up is more significant in the context of a low risk product.

Possible solutions to improve the index

The industry could lobby MSCI to calculate an index for Australian investors, but there may be additional cost involved for users. Fund custodians could replicate the index in their systems and estimate the performance of the index on a like-for-like basis with how they calculate fund performance. Super funds could explicitly remind the investment committee and board that there is this understatement issue when it comes to assessing the performance of global shares.

Benchmarks are more difficult to calculate than a first glance may suggest. Our industry is so big that issues like this which appear minor can have impacts which cost tens of millions of dollars. It could lead to a significant amount of management fees being spent, perhaps on an uninformed basis, on actively-managed global equities. It’s a complex system, isn’t it …?


David Bell is Chief Investment Officer at Mine Wealth + Wellbeing. He is also working towards a PhD at University of NSW.


6 Comments
Tortoise
November 26, 2015

I've only invested based on what fund managers report, not the index. The out performance by those like Vanguard has been evident for a while.

David Bell
November 26, 2015

Hi Peter Vann and Cranky Pants,

MSCI does publish a gross of dividends index but this too is a flawed benchmark to judge the active performance of fund managers. This overstates performance compared to what would be experienced by a passive investor because passive investors would pay withholding tax and the gross index does not account for this appropriately.

The true performance experience for Australian investors lies somewhere in between the net and gross indices and can only be accurately represented by a tailored index calculated based on the withholding tax experience of Australian institutional investors.

Cheers, David

cranky pants
November 26, 2015

just give some money to an index manager and use their return, calculated by your custodian after fees and taxes, as the real-world benchmark for active managers

David Bell
November 27, 2015

Dear Cranky Pants,

I appreciate your suggestion as it sounds so simple but I'm not sure it stacks up in practice. Consider the costs of investment due diligence (not all index managers are equal) and operational due diligence, legal costs on an IMA (investment management agreement), custody costs (account set-up, accounting and reporting), as well as transition costs (the money has to come from somewhere to fund this exposure). There is also the opportunity costs of active management performance foregone (assuming we believe in that, hence the need to benchmark). So say for a $100m mandate (which I will assume as the minimum size to get a mandate) and a 1% alpha (real alpha accounting for the identified flaw) then we have an expected opportunity cost of $1m pa plus a range of one-off and ongoing costs. To me this sounds like an expensive way to get true index performance data - I don't think I would do this on behalf of my members.

The problem of inaccurate benchmark performance data affects all industry participants but unfortunately your suggestion is relevant to only a small number of funds. Assume global equities makes up 25% of assets, the minimum mandate size is $100m and that, because you believe in active management but want good benchmark data you are prepared to allocate 10% of your global equities pool to a passive exposure: your idea is relevant to super funds with assets under management of $4b plus, so probably 50 out of the 250 institutional funds. I'd like to see an accessible solution for all of the industry.

Finally, the index mis-statement issue is larger for higher yielding sectors such as global property securities and listed infrastructure. So I guess if I ran with your idea I would have to have some passive exposure to each sector where this issue exists, and be large enough to meet mandate size requirements in each of these sectors which are more niche and so on... so perhaps only a few really large funds could implement your suggestion and the opportunity costs could now be in the millions!

So thanks for your suggestion but I'm not sure I'd be running with it. I'd prefer to see the index groups come out with better solutions or funds make more simple adjustments.

Cheers, David

cranky pants
November 26, 2015

MSCI still publishes gross returns for World ex Australia so no problems to change benchmark. an even bigger step is publishing net of Australian tax indices ....measuring all managers against an appropriate alternative like anindex portfolio, not an index, to take real world effects into account makes sense to me.

Peter Vann
November 26, 2015

Hi David

I'm glad that this has been raised. It is interesting how many are unaware of this issue.

My recollection from the 1990s when my team ran an indexed international equities fund is that there were two MSCI indexes, one net of with holding taxes and a gross one. We used to use the gross one and work to claim back as much of the with holding taxes as reasonably possible (unfortunately not all) so our aim was to reduce the under performance of the "better" (i.e. high return) benchmark for the clients! And reporting both gross and net, at least then one can see the success of "tax claw back".

Do MSCI still report both gross and net returns?

Cheers
Peter


Leave a Comment:


RELATED ARTICLES

Four ways to determine your international equities allocation

‘Prepare for war’ with hostile markets

To hedge or not to hedge?

banner

Most viewed in recent weeks

Vale Graham Hand

It’s with heavy hearts that we announce Firstlinks’ co-founder and former Managing Editor, Graham Hand, has died aged 66. Graham was a legendary figure in the finance industry and here are three tributes to him.

Warren Buffett is preparing for a bear market. Should you?

Berkshire Hathaway’s third quarter earnings update reveals Buffett is selling stocks and building record cash reserves. Here’s a look at his track record in calling market tops and whether you should follow his lead and dial down risk.

US election implications for investors and Australia

The return of Donald Trump to the US presidency brings the prospect of more US tax cuts and deregulation, but also more tariff hikes, trade wars and policy uncertainty. Here's what it means for markets going forward.

Avoiding wealth transfer pitfalls

Australia is in the early throes of an intergenerational wealth transfer worth an estimated $3.5 trillion. Here's a case study highlighting some of the challenges with transferring wealth between generations.

Taxpayers betrayed by Future Fund debacle

The Future Fund's original purpose was to meet the unfunded liabilities of Commonwealth defined benefit schemes. These liabilities have ballooned to an estimated $290 billion and taxpayers continue to be treated like fools.

The rising tension between housing debt and retirement balances

Australians are taking more mortgage debt into their 60s than ever before. Retirement planning assumptions haven’t adapted and could result in future income projections that ultimately disappoint retirees.

Latest Updates

Shares

Australian stocks will crush housing over the next decade, one year on

Last year, I wrote an article suggesting returns from ASX stocks would trample those from housing over the next decade. One year later, this is an update on how that forecast is going and what's changed since.

Superannuation

Addressing the gender super gap

The harsh reality is that most women retire with significantly less superannuation than men. There are many reasons for the gender super gap and here are some possible solutions to fix the long-running issue.

Superannuation

Meg on SMSFs: Where are the risks in our major super sectors?

Given the amount of money in super, it’s not surprising that there is a lot of focus on risk. SMSFs are often portrayed as the riskier option for the community as a whole, but does that tell the full story?

Superannuation

Global pension reforms and how Australia can improve

With plans to retire next year, Mercer's David Knox looks back at the global pension index he helped create, the key trends and developments since inception, and what Australia can to do to get better.

Shares

Cyclical stocks will drive markets higher in 2025

Magellan's Head of Global Equities, Arvid Streimann, thinks that although stock price momentum will slow next year, cyclical companies will lead the pack. He outlines the risks to his forecast and the stocks he likes best.

Economy

How this GDP per capita recession compares to history

GDP was 0.3% for last quarter but the real story is this was Australia’s seventh consecutive quarter of negative GDP per capita growth. How does this economic drought compare to past ones, and what can we expect in future?

Investing

The mispriced investment opportunity in global defence

Markets benefitted from peace for 40 years, but a military resurgence is now underway, fuelled by geopolitical tensions and technological advancements. Defence spending is soaring, offering potential opportunities for investors.

Sponsors

Alliances

© 2024 Morningstar, Inc. All rights reserved.

Disclaimer
The data, research and opinions provided here are for information purposes; are not an offer to buy or sell a security; and are not warranted to be correct, complete or accurate. Morningstar, its affiliates, and third-party content providers are not responsible for any investment decisions, damages or losses resulting from, or related to, the data and analyses or their use. To the extent any content is general advice, it has been prepared for clients of Morningstar Australasia Pty Ltd (ABN: 95 090 665 544, AFSL: 240892), without reference to your financial objectives, situation or needs. For more information refer to our Financial Services Guide. You should consider the advice in light of these matters and if applicable, the relevant Product Disclosure Statement before making any decision to invest. Past performance does not necessarily indicate a financial product’s future performance. To obtain advice tailored to your situation, contact a professional financial adviser. Articles are current as at date of publication.
This website contains information and opinions provided by third parties. Inclusion of this information does not necessarily represent Morningstar’s positions, strategies or opinions and should not be considered an endorsement by Morningstar.