Register For Our Mailing List

Register to receive our free weekly newsletter including editorials.

Home / 24

Investing against the herd: resisting emotion

One of the most difficult aspects of investing is learning how to remove emotion from the decision-making process and just focus on the facts. Investors need to resist the temptation to get caught up in the hype of the daily news and noise, and to have the courage to go against the herd if that is what the facts dictate.

Investors who follow the herd invariably end up buying at or near the tops of booms when everybody else is buying and when the media and the so-called ‘experts’ are most euphoric. Then they often end up selling when everybody else is selling, when the media is most pessimistic at the bottom of the busts.

One of Warren Buffett’s simplest but hardest to follow gems of wisdom is to be greedy when others are fearful and to be fearful when others are greedy. This is much easier said than done!

Most investors seek reassurance

The first step is to learn to ignore the popular media, and especially the so-called financial media, and all the well-meaning advice or hot tips from friends, family and neighbours over the back fence. That is difficult enough, but it is even more difficult to go to the next to step and actually go against the herd and sell in booms and buy in busts. This goes completely against human nature. Humans are social animals who constantly seek reassurance from the herd, and are prone to follow the weight of popular opinion.

As a result, most investors (individuals and institutions) buy high and sell low - ie they are bullish and buy (or worse still, gear up and buy) at or near the tops of booms, and then they are bearish and sell (or worse still, are forced to sell by their margin lender) at or near the bottom of busts.

Two prime examples of this I saw first-hand were the crazy bursts of share buying and gearing up fuelled by the introduction of franking credits in 1987, and a similar crazy burst of share buying and gearing up in the months leading up to the closing of the $1 million super contributions window in June 2007. On both occasions, investors everywhere sold other assets (incurring tax on capital gains) and threw the money at the stock market in the media frenzy, only to see their money halve in value in the crashes that followed immediately after. If they used gearing they lost more than half and many thousands of people were wiped out completely. The extra flood of money and debt accelerated the market rises in 1987 and 2007, and so markets had further to fall when they collapsed.

I have used the following chart hundreds of times in presentations. It always gets a laugh, whether the audience is first time individual investors or experienced fund managers.

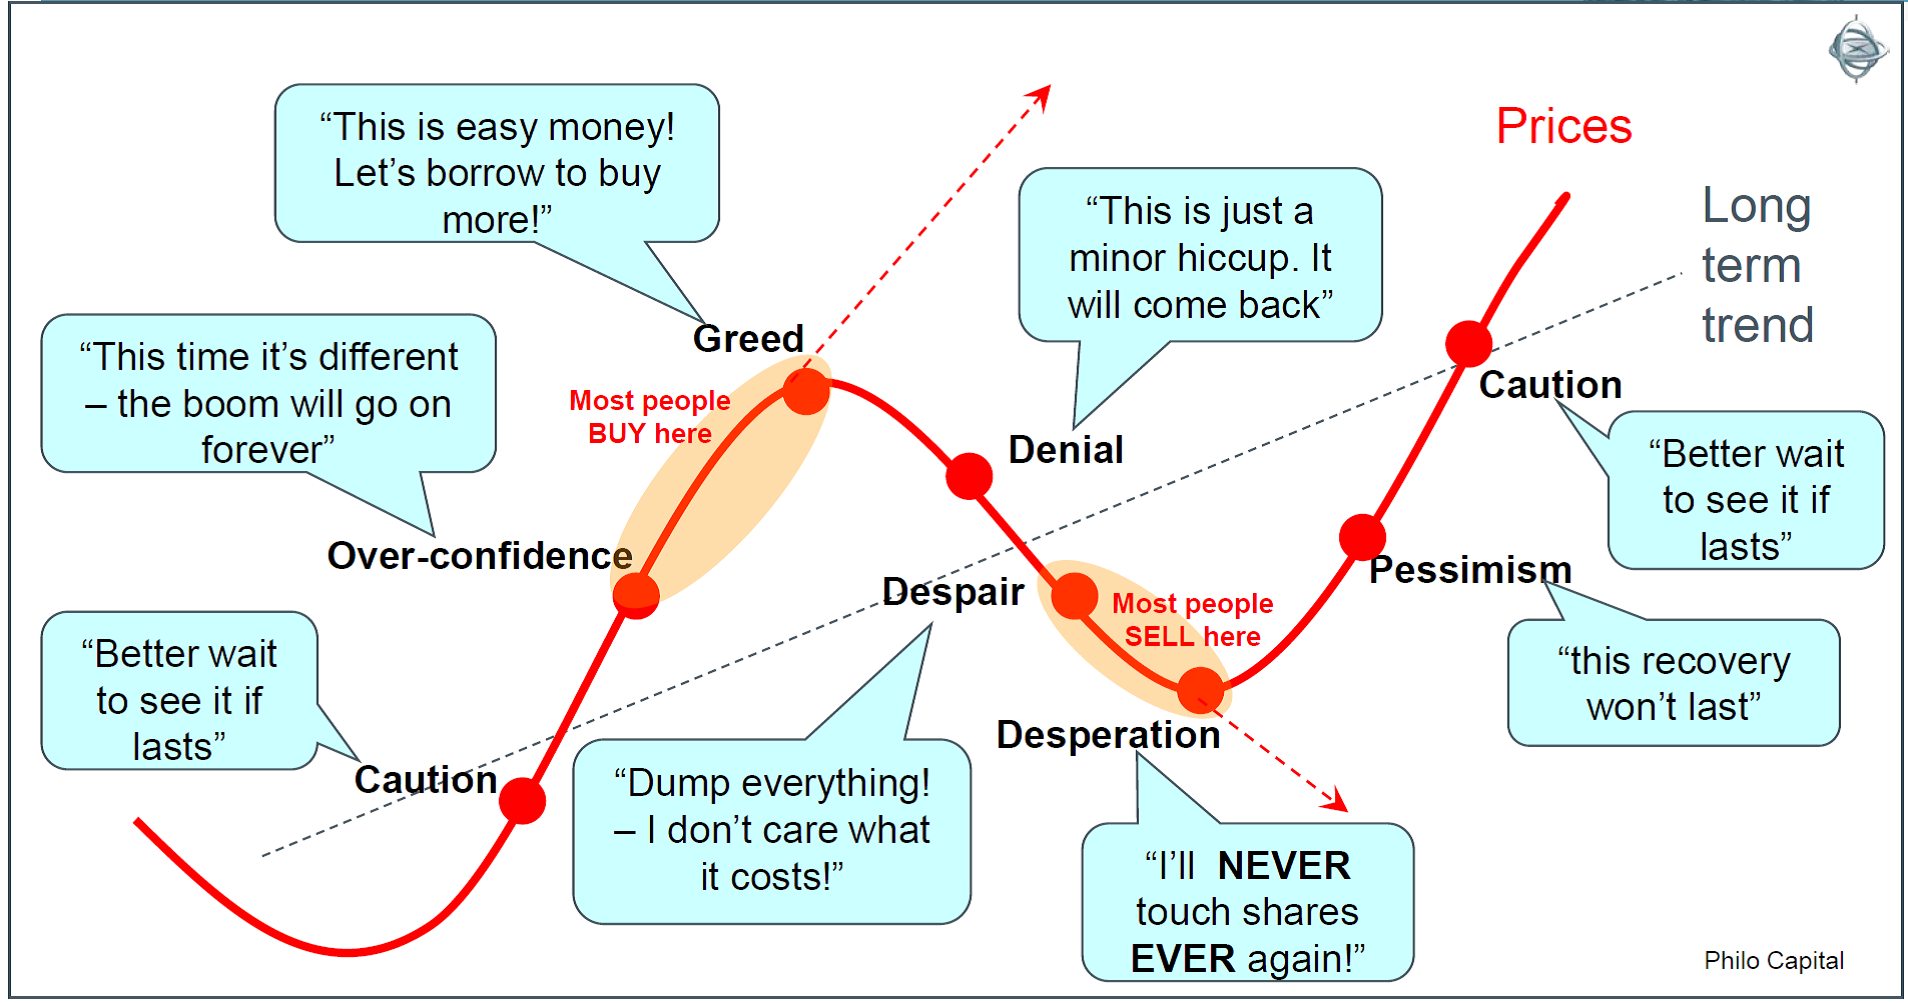
They laugh mostly because they know it is true but also because they know that humans are almost powerless to avoid the traps because it happens in every cycle.

Buying more as prices rise

Investors like to see prices (of shares or any other investment) rising. The longer prices keep rising, the more assurance they have that ‘this time it’s different’ and that prices will keep on rising in the future. Often they sit cautiously on the sidelines waiting and watching the market rise for several years before they finally pluck up the courage to take the plunge - inevitably right at the top before the fall.

Conversely, when prices are falling it is very easy to succumb to the general market and media pessimism and start believing that prices will keep on falling in future. Investors who bought in the boom hang on grimly, watching the market keep falling, hoping it will miraculously bounce back. Then finally, after all hope is lost and when the media are most pessimistic, they sell out in despair - often right at the bottom just before the rebound.

Individuals follow this pattern because they’re humans. Fund managers end up falling into the same trap because the majority of them are index-huggers. In the booms most of them know they shouldn’t be buying shares when they are over-priced but they still grit their teeth and keep buying anyway, because they are terrified of falling too far behind the general market index. Likewise in the busts they know they shouldn’t be selling shares cheaply but they have no choice but to sell because they have to meet fund redemptions as investors withdraw their funds in the panic. The end result is the same as for individuals - they buy high and sell low.

The above chart is a fun caricature and we should test the theory that people really are most bullish at the top of booms right before the busts, and they really are most bearish at the bottom of busts right before the market rebounds.

In Part 2 next week, we look at consumer sentiment measures in Australia as an indication of investor optimism. You may be surprised just how closely investors in the real world follow this simple pattern of behaviour in every stock market cycle.


Ashley Owen is Chief Investment Officer at advisory firm Stanford Brown and The Lunar Group. He is also a Director of Third Link Investment Managers, a fund that supports Australian charities. This article is general information that does not consider the circumstances of any individual.


3 Comments
Warren
August 06, 2013

You are right to say, near the end, that this is a "theory" that needs testing. There have been quite a lot of institutional surveys over the years of fund manager sentiment and strategy that can be used - maybe a bright young Masters student could find a thesis in that?

But for me it's even more important to test the theory that markets behave in such smooth cycles! Can you show me an actual market that, in reality, behaves anything like this? Or even if one does, over say a ten year period, does it over 20 or 30 years? I don't see many and I've been looking for more than 30 years for these sorts of simple patterns.

I'm not denying that many investors get their timing very wrong, often in the manner described here. But to suggest in a blanket fashion that selling after a market has fallen is always the wrong thing to do is dangerous, frankly.

For example, a Japanese investor who sold out of the Nikkei in late 1990 after it had fallen from 39,000 to 25,000 is still glad they did. It's never been back as high as their selling level since, and is at only 14,000 now.

Or someone who owned tech stocks, via say the NASDAQ index, but sold out in early 2001 after a 54% decline from the peak a year earlier, then watched the market slide even further over the next few years. It bounced, then fell again in 2008-09. It is only in the last couple of years that this market index has more convincingly started to trade through and above the 2,500 sell level of 2001.

These are extreme examples, I know, but very real cases where the simple rule that says "never sell after a market has fallen" is plainly unhelpful. I think investors who did that in those cases did exactly the right thing.

Paul Thind
August 06, 2013

Very good summary of how retail investors in general and many active managers behave. Question is how to change this behavior, or if it can be changed? Our work shows that investing through measurement is far superior compared with active and often emotional decision making processes that rely on the skill of one or even a group of individuals.
The problem is that most participants in the markets don't have the education or perhaps even the time to understand their investments. The smarter people are always in front. If one looks at Hedge Fund Managers performance, it is obvious that quite often it is not the same smart people.
It is all very well to draw historical graphs and mark them with behavior states. Knowing what phase of the economic or stock market cycle one is in is extremely difficult. Continuous measurement and automated responses is perhaps the most efficient way to determine future price development of risky assets.

Tan Boon Pin
August 01, 2013

Thanks. A good write up ...


Leave a Comment:

RELATED ARTICLES

'FOMO' is driving residential property prices, not yields

Roy Morgan Research places SMSFs first for satisfaction

banner

Most viewed in recent weeks

Australian house prices close in on world record

Sydney is set to become the world’s most expensive city for housing over the next 12 months, a new report shows. Our other major cities aren’t far behind unless there are major changes to improve housing affordability.

The case for the $3 million super tax

The Government's proposed tax has copped a lot of flack though I think it's a reasonable approach to improve the long-term sustainability of superannuation and the retirement income system. Here’s why.

Tariffs are a smokescreen to Trump's real endgame

Behind market volatility and tariff threats lies a deeper strategy. Trump’s real goal isn’t trade reform but managing America's massive debts, preserving bond market confidence, and preparing for potential QE.

The super tax and the defined benefits scandal

Australia's superannuation inequities date back to poor decisions made by Parliament two decades ago. If super for the wealthy needs resetting, so too does the defined benefits schemes for our public servants.

Meg on SMSFs: Withdrawing assets ahead of the $3m super tax

The super tax has caused an almighty scuffle, but for SMSFs impacted by the proposed tax, a big question remains: what should they do now? Here are ideas for those wanting to withdraw money from their SMSF.

Getting rich vs staying rich

Strategies to get rich versus stay rich are markedly different. Here is a look at the five main ways to get rich, including through work, business, investing and luck, as well as those that preserve wealth.

Latest Updates

SMSF strategies

Meg on SMSFs: Withdrawing assets ahead of the $3m super tax

The super tax has caused an almighty scuffle, but for SMSFs impacted by the proposed tax, a big question remains: what should they do now? Here are ideas for those wanting to withdraw money from their SMSF.

Superannuation

The huge cost of super tax concessions

The current net annual cost of superannuation tax subsidies is around $40 billion, growing to more than $110 billion by 2060. These subsidies have always been bad policy, representing a waste of taxpayers' money.

Planning

How to avoid inheritance fights

Inspired by the papal conclave, this explores how families can avoid post-death drama through honest conversations, better planning, and trial runs - so there are no surprises when it really matters.

Superannuation

Super contribution splitting

Super contribution splitting allows couples to divide before-tax contributions to super between spouses, maximizing savings. It’s not for everyone, but in the right circumstances, it can be a smart strategy worth exploring.

Economy

Trump vs Powell: Who will blink first?

The US economy faces an unprecedented clash in leadership styles, but the President and Fed Chair could both take a lesson from the other. Not least because the fiscal and monetary authorities need to work together.

Gold

Credit cuts, rising risks, and the case for gold

Shares trade at steep valuations despite higher risks of a recession. Amid doubts that a 60/40 portfolio can still provide enough protection through times of market stress, gold's record shines bright.

Investment strategies

Buffett acolyte warns passive investors of mediocre future returns

While Chris Bloomstan doesn't have the track record of his hero, it's impressive nonetheless. And he's recently warned that today has uncanny resemblances to the 1990s tech bubble and US returns are likely to be disappointing.

Sponsors

Alliances

© 2025 Morningstar, Inc. All rights reserved.

Disclaimer
The data, research and opinions provided here are for information purposes; are not an offer to buy or sell a security; and are not warranted to be correct, complete or accurate. Morningstar, its affiliates, and third-party content providers are not responsible for any investment decisions, damages or losses resulting from, or related to, the data and analyses or their use. To the extent any content is general advice, it has been prepared for clients of Morningstar Australasia Pty Ltd (ABN: 95 090 665 544, AFSL: 240892), without reference to your financial objectives, situation or needs. For more information refer to our Financial Services Guide. You should consider the advice in light of these matters and if applicable, the relevant Product Disclosure Statement before making any decision to invest. Past performance does not necessarily indicate a financial product’s future performance. To obtain advice tailored to your situation, contact a professional financial adviser. Articles are current as at date of publication.
This website contains information and opinions provided by third parties. Inclusion of this information does not necessarily represent Morningstar’s positions, strategies or opinions and should not be considered an endorsement by Morningstar.