Even if you don’t hold any technology stocks or tech-sector funds, your portfolio might be more tech-heavy than you think. If you invest in a US index fund, the tech sector now accounts for 24.2% of the S&P 500.
Communication services, which is home to tech-oriented leaders such as Alphabet (NAS:GOOGL), Facebook (NAS:FB), and Twitter (NYS:TWTR), made up another 11% of the benchmark as of 31 October 2020.
Tech leaders have dominated returns for the index for seven years running; as a result, the largest companies in the index are all big tech names, including Apple (NAS:AAPL), Microsoft (NAS:MSFT), Amazon.com (NAS:AMZN), and Facebook. (Amazon is officially part of the consumer cyclical sector, but obviously tech related.) Those five companies alone now account for about 23% of the index’s value.
Because the S&P 500 is such a widely-used benchmark, thousands of index funds, Exchange Traded Funds, and actively-managed funds also have large amounts of exposure to the tech sector. While there are good reasons behind tech’s growing dominance, it also warrants a bit of caution. In this article, I’ll delve into what’s been driving the surge in tech stocks, why this is potentially problematic for investors, and how to adjust your portfolio to mitigate the risk.
The rising tide
Over the past 31 years, the tech sector’s weighting has nearly tripled as a percentage of the S&P 500. Over that period, the weighting has been as low as 6.3% (at the end of 1992) and as high as 33.0% (in August 2000). The high-water mark in 2000, of course, marked the beginning of the end of the tech bubble, when hundreds of Internet startups with inflated valuations quickly dropped down to earth. More established tech names held up better but also experienced significant drops. Between 2000 and the end of 2003, Morningstar’s US Technology Index lost more than 70% of its value in cumulative terms.
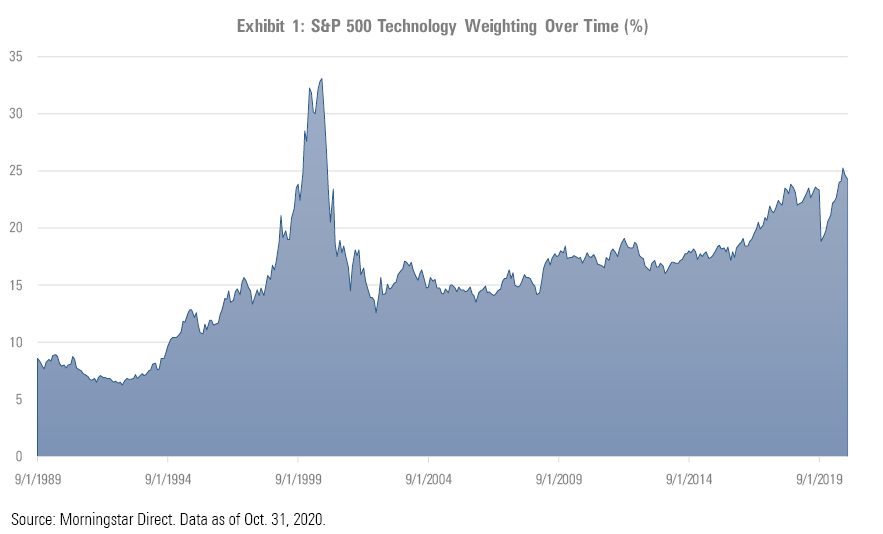
Since then, the sector has steadily climbed, suffering only a temporary drop during the fourth quarter of 2018’s market jitters. Tech stocks even held up better than average when the novel coronavirus roiled the market in March 2020. More recently, some market pundits have even gone so far as to describe technology as a safe haven.
No worries?
The size of any sector’s weighting in itself doesn’t necessarily mean a correction is imminent. Market valuations represent the collective wisdom of market participants about the underlying value of each company.
Many of the more recent shifts in sector weightings reflect changes in the nature of the economy. We can look at sector weightings going back to September 1989 (the earliest date for Morningstar’s sector data) to see how the overall makeup of 'the market' has shifted over time. Over the past 31 years, old-economy sectors, such as basic materials, energy, consumer goods, and industrials, have all declined, while technology, healthcare, communication services, and financial services have increased in percentage terms.
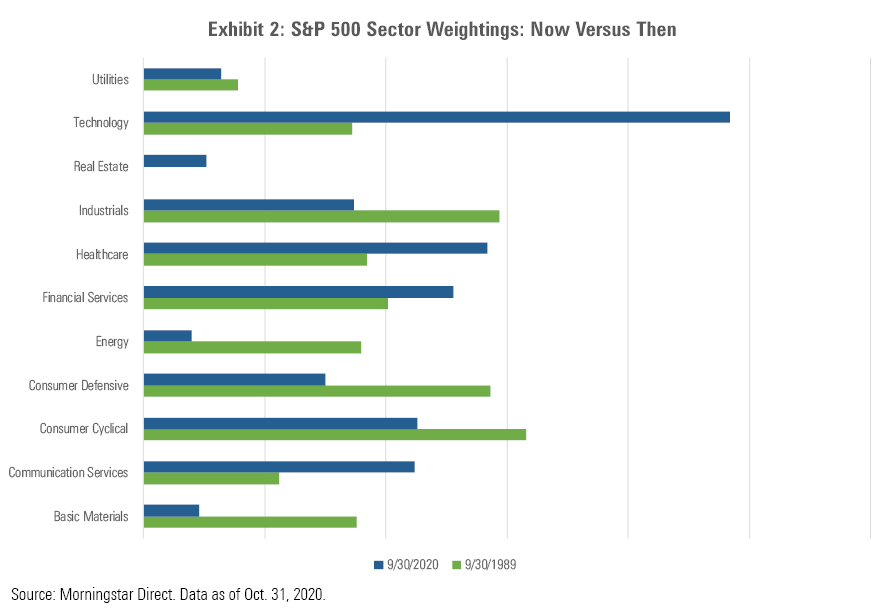
To a large extent, these changes reflect the underlying economic contributions of each company. If we aggregate all of the financial statements for the companies included in the S&P 500, for example, the tech sector accounts for a large percentage of the total revenue, operating income, and free cash flow generated over the past 12 months. Those are all key inputs that help drive the underlying value of a company.
What’s more, equity values are forward-looking, so the large tech weighting also reflects the expectation that companies in the sector will continue generating above-average growth. Indeed, the median five-year earnings growth estimates from Wall Street analysts are higher for companies in the tech sector than nearly any other sector.
The positive trends driving technological growth show no signs of stopping. Some of these include the acceleration of digital tools in all aspects of life, 5G mobile network standards, and productivity-enhancing technologies like artificial intelligence and robotic automation.
Potential danger signs
But even if tech lives up to its high growth expectations, are the assumptions baked into current stock prices too high?
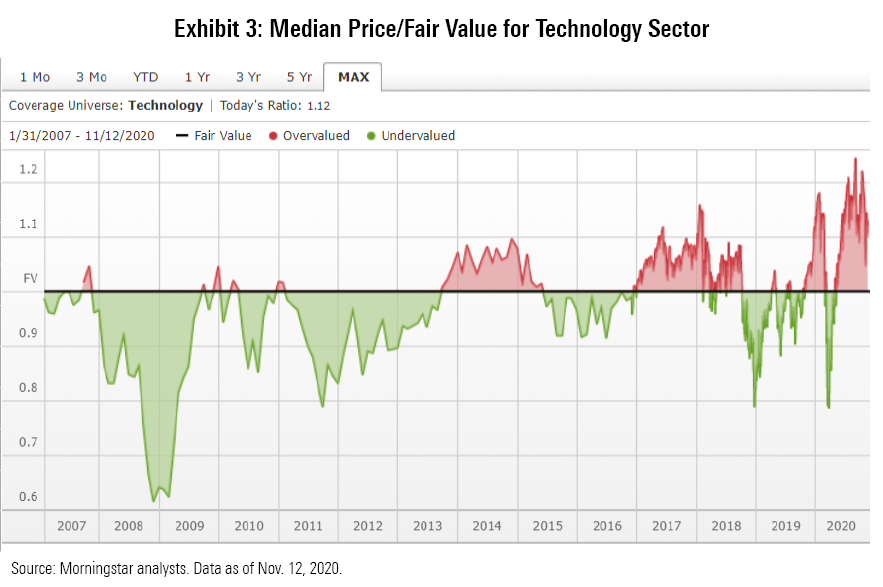
Morningstar’s equity analysts calculate fair value estimates for individual stocks under analyst coverage, with the values based on detailed models of projected future cash flows (discounted to present value). On that basis, tech-stock valuations look a bit steep. As of 12 November 2020, the median tech stock in our coverage universe was trading at a price/fair value ratio of 1.12. That’s down a bit from a recent peak in October 2020, but still relatively rich.
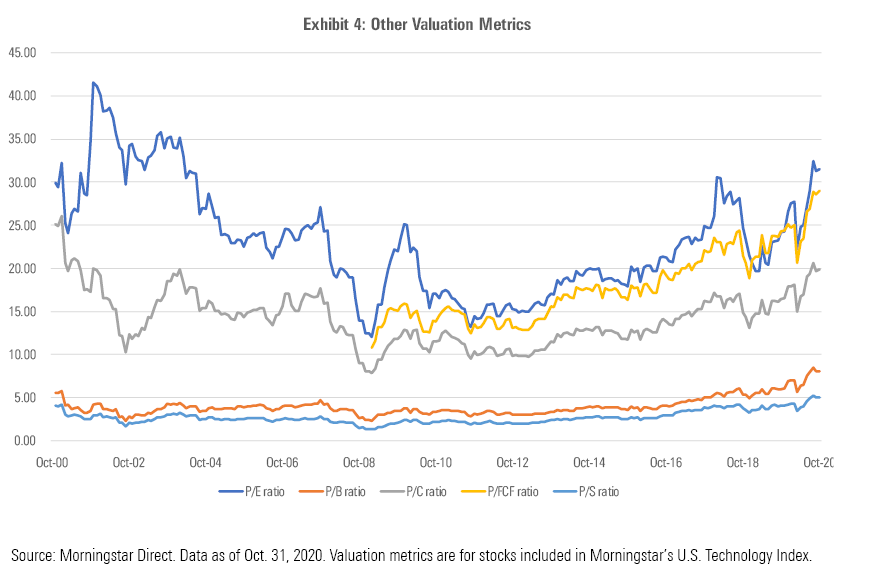
Other valuation metrics also look relatively lofty compared with historical levels, as shown in the chart below. Average ratios for price/earnings, price/book, price/cash flow, and price/sales have all been on an upward trend over the past several years. Three of these four metrics now stand higher than they did at the end of 2000. Morningstar’s historical data for price/free cash flow doesn’t start until 2009, but that metric is also well above past levels.
Portfolio tweaks for tech-wary investors
None of this data is a flashing red light suggesting that investors should bail out on tech stocks. But I think there’s enough evidence to warrant some caution.
A logical first step is to figure out exactly how exposed you are to the sector. In addition to hefty weightings in most market indexes, any individual stock holdings you own may have ballooned to surprising levels. Making matters worse, many of these holdings have large unrealised gains, making the prospect of selling pretty unappetising.
One way to dial back tech exposure is to consider adding positions in other areas as a counterweight. Adding assets to a value-oriented fund is one way to counterbalance the tech-oriented growth stocks that have dominated the market in recent years. Finally, consider adding a small stake in sectors that have historically had lower correlations with the tech sector, such as energy, utilities, and real estate.
Amy C. Arnott, CFA, is Director of Securities Analysis for Morningstar. This article is general information and does not consider the circumstances of any investor. It has been modified somewhat from the original US version for an Australian audience.
Register for a free trial of Morningstar Premium on the link below, including the portfolio management service, Sharesight.
Try Morningstar Premium for free