It is well known that equities are subject to both booms and busts, testing the discipline of most investors and leading legendary investor Warren Buffett to conclude: “Investing is simple, but not easy.” Perhaps the best example of the boom-and-bust nature of equity markets is the late 1990s. From January 1995 through February 2000, the S&P 500 boomed, returning 25.8% per year. By the end of the period, the Shiller CAPE 10 had reached 42.2, producing an earnings yield of just 2.4%. The CAPE 10 earnings yield has been as good a predictor as we have of future equity returns. At the time, the yield on 10-year Treasury Inflation-Protected Securities was in excess of 4%. In other words, the expected real return to equities was almost 2 percentage points less than the riskless real return on TIPS. If anything is a sign of a bubble, that is the leading candidate. Then, from March 2000 through September 2002, the S&P 500 “busted,” producing a cumulative loss of 38.3%.
Another boom and bust was experienced from October 2002 through October 2007 when the S&P 500 returned 15.5% per year. That boom, which pushed the CAPE 10 to 27.3, producing an earnings yield of 3.6% (just 1.5 percentage points above that of the yield on 10-year TIPS), ended in a bust that saw the S&P 500 lose a total of 51.0% from November 2007 through February 2009.
The next boom and bust occurred a decade later. After returning 26.1% a year from 2019 through 2021, producing a total return of just over 100% in three years—a boom that pushed the CAPE 10 to 38.3 (an earnings yield of just 2.6%)—from January through September 2022, the S&P 500 lost 23.9%.
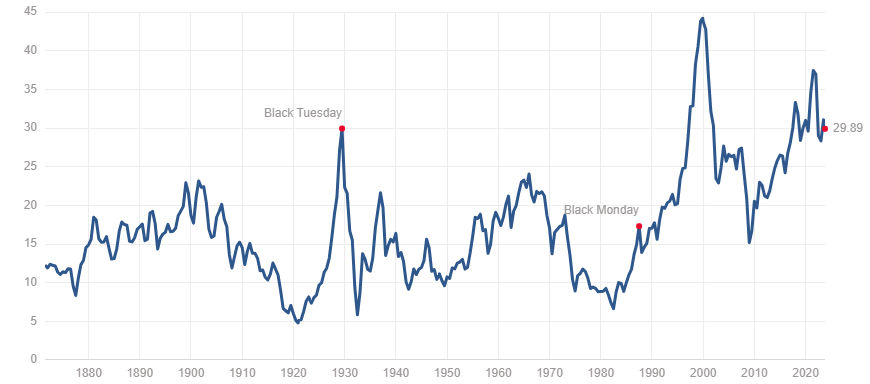
Source: https://www.multpl.com/shiller-pe. As of Oct 16 2023.
The historical data demonstrates that extremes in the right tail of the return distribution (caused by rising valuations) can portend sharp reversals and painful performance downturns.
Empirical research
Academic research has found some useful metrics in terms of predicting markets. For example, it has found that credit growth is a relevant predictor of financial crises and that a bull equity market, combined with strong credit growth, indicates a higher likelihood of a banking crisis. Research has also found that acceleration in price momentum leads to greater instability in future prices and that market crashes are typically preceded by a bubble phase, characterized by a rapid acceleration in asset prices. And finally, in their famous 1988 paper “Stock Prices, Earnings and Expected Dividends,” Robert Shiller and John Campbell established that future equity market returns are negatively related to the cyclically adjusted price/earnings ratio (the CAPE 10), providing a basis for equity market valuation as a predictor of future returns.
New research
Steve Sapra, Josh Davis, German Ramirez, and Marc-Antoine Loo contribute to the literature with their study “Equity Fragility,” published in the July 2023 issue of The Journal of Portfolio Management, in which they developed a framework for assessing the likelihood of large equity market drawdowns. They built a regression model based on macroeconomic variables (yield curve slope using the 10-year yield minus the three-month yield, year-over-year inflation percentage change and three-year credit growth); a technical metric (the 12-month Sharpe ratio for equities); and a valuation metric (the equity dividend yield) for both the United States and a cohort of four additional developed markets (Australia, Germany, Japan, and the United Kingdom). Their sample covered the period from March 31, 1951, through Aug. 31, 2022. Here is a summary of their key findings:
- Across the five markets, drawdowns of up to 5% occurred in 38.3% of the months, with 8.2% of the drawdowns occurring during recessions. Drawdowns of 5% to 10% occurred in 18.3% of the months, with 13.4% of the drawdowns occurring during recessions. Drawdowns of 10% to 20% occurred in 19.3% of the months, with 21.8% of the drawdowns occurring during recessions. And drawdowns of more than 20% occurred in 11.9% of the months, with 38.9% of the drawdowns occurring during recessions. The pattern makes clear that while the more-severe drawdowns are more likely to occur during recessions, most do not—the likely explanation is that the market is a leading economic indicator, tending to fall in anticipation of recessions.
- Large equity market drawdowns were generally more explainable than small drawdowns. However, as the drawdown size increased, the number of factors that met the threshold of statistical significance increased, as did the R-squared value—it is difficult to predict small equity market declines relative to their larger counterparts.
- Since 1951 global markets had returned, on average, 7.6% over cash and experienced an average drawdown of 15.0% over a one-year horizon. However, on average, when the drawdown probability was above 30%, global markets performed poorly over the following year, with an excess return of negative 1.7% and an average drawdown of 22%. For probabilities below 30%, the average excess market return and drawdown were 11.4% and 12.2%, respectively.
- Market crashes historically have been associated with a set of factors centered around valuation (particularly dividend yield), technical (the 12-month Sharpe ratio), and macroeconomic (inflation and credit growth) indicators.
- Their model showed a likelihood of a crash of more than 80% prior to the crashes in 1973 and 2000, and more than 60% prior to the crash that began in late 2007. In 2021 the likelihood of a crash was less than 20% but by August 2022 had risen to above 80%.
- Their framework was effective for both recessionary and non-recessionary drawdowns.
- Valuation was the only factor that showed a high degree of statistical significance across all markets except Japan (for which no factor was statistically significant). However, by pooling data (and excluding Japan) almost all factors were statistically significant, with inflation being the most significant (t-stat = 5.34), followed by valuation (t-stat = negative 4.88).
- While the U.S. was a fundamental driver of “market fragility” globally—the incremental effect of a U.S. drawdown was 0.31, implying a 31% increase in each country’s conditional drawdown probability if the U.S. equity market were impaired—country-specific factors were still relevant for predicting the likelihood of large equity market drawdowns.
The finding that valuations play an important role in forecasting future equity returns and the risk of large market drawdowns is consistent with prior literature, including the 2012 study “An Old Friend: The Stock Market’s Shiller P/E,” the 2022 study “Equity Risk Premiums (ERP): Determinants, Estimation, and Implications,” and the 2023 study “The Continued Forecasting Effectiveness of a Real Earnings Model of the Equity Premium.”
With that said, the research also shows that starting valuations clearly matter, and they matter a lot. Higher starting values mean that not only are future expected returns lower (and vice versa), but the best outcomes are lower and the worst outcomes worse. However, a wide dispersion of potential outcomes, for which we must prepare when developing an investment plan, still exists—high (low) starting valuations don’t necessarily result in poor (good) outcomes.
Investor takeaways
Sapra, Davis, Ramirez, and Loo demonstrated that global equity drawdowns have generally been associated with a common set of characteristics centered around valuation, macroeconomic, and technical variables. They also demonstrated that a drawdown in the U.S. is highly indicative that a non-U.S. market is also in a drawdown—the U.S. acts as a fundamental driver of global equity market fragility. However, country-specific factors (such as valuation, yield curve slope, and inflation) contain information beyond just the impact of the U.S.—although the U.S. matters a lot, it isn’t everything. Perhaps most importantly, they showed that expensive markets are not only predictive of lower future returns but also of increased fragility.
Turning to conditions today, the strong performance of the S&P 500 in 2023 pushed the CAPE 10 to 28.9, producing an earnings yield of just 3.5%. Assuming valuations don’t revert toward their historical mean (in which case realized returns would likely be lower), investors in the stocks of the S&P 500 should expect to earn a real return over the next decade of just 3.5%, half its long-term historical average compound real return of 7%. Adding the current spread between 10-year Treasuries and 10-year TIPS (providing an estimate of inflation) of about 2.4% provides a forecast nominal return of 5.9%, about 60% of the S&P 500's historical nominal return of about 10%.
This provides two warnings for investors.
First, valuations are historically high, and high valuations are correlated with the increasing risk of a crash.
Second, investors who build plans using historical returns to both stocks and bonds (bond yields are still well below historical averages) are likely to be disappointed, increasing the risk of failing to achieve financial goals.
What can investors do to address these issues?
One way to reduce both risks is to increase allocations to international equities. Using Morningstar data, Vanguard Total Stock Market Index Fund VTSMX had a current P/E ratio of 18.4 and Vanguard 500 Index Fund VFINX had an even higher P/E of 19.5, but Vanguard Developed Markets Index Admiral Fund VTMGX had a P/E of just 13.0, while the Vanguard Emerging Markets Index Fund VEIEX had an even lower P/E of 13.2. The much lower P/Es not only project higher expected returns, but they also reduce crash risk. We see similar results with the CAPE 10 (as of June 30) for the S&P 500, the MSCI EAFE Index, and the MSCI Emerging Markets Index: 3.2%, 5.6%, and 7.3%, respectively.
Another way to address the risks of high valuations is to increase allocations to small-value stocks.
The evidence makes clear that estimating future equity returns isn’t a simple task. It’s why trying to time markets based on short-term forecasts has proved so difficult, and why legendary investors such as Warren Buffett (“The stock market serves as a relocation center at which money is moved from the active to the patient”) and Peter Lynch (“Far more money has been lost by investors trying to anticipate corrections than has been lost in all the corrections combined”) advised against it.
With that said, because financial plans are developed without the benefit of a clear crystal ball, the best tools available should be used. However, when using these tools, the evidence demonstrates that healthy skepticism about the accuracy of forecasts is needed. Be careful not to treat outcomes from models in a “deterministic” fashion. Instead, treat them only as the mean of a very wide potential dispersion of possible outcomes.
Larry Swedroe is head of financial and economic research with Buckingham Strategic Wealth. The views expressed here are the author’s. For informational and educational purposes only and should not be construed as specific investment, accounting, legal, or tax advice. The author own shares in one or more securities mentioned in this article.