Register For Our Mailing List

Register to receive our free weekly newsletter including editorials.

Home / 12

Look towards your investment horizon

A friend was telling me about an old guy who used to live across the road from him. Known only as Mr Storm, he was 104 years old when he died recently. As a young man, Mr Storm had been a sugar broker in Indonesia, and came back to Australia after the Second World War with a decent amount saved. He managed his own portfolio, and as it grew substantially, he became a major supporter of many charities.

One day, the friend was chatting to Mr Storm on his front verandah, where he was soaking up the midday sun. As often happened, the conversation was interrupted by a phone call from the old man’s broker, and the friend heard BHP discussed. After the call, my friend said, “I saw BHP fell back 30 cents yesterday, to around $38. It’s lost a bit recently.” Mr Storm cleared his throat and barely lifted his head, the sun bright on his pale skin. “Most of mine cost me $6 in 1967,” he replied.

I tell this story because the perception of the market’s performance, whether it’s a good place to invest, depends on your investment horizon. Or more specifically, your entry point, because performance is usually determined by when you buy, especially for an investor rather than a trader. It’s amazing to recall that the Commonwealth Bank was floated in 1991 at $5.40, and 22 years later, not only is it now $68, but it paid a fully franked dividend of $3.61 last year. Should anyone who bought it in the float really care if the share price falls 10% or 20%?

If you saw the graph below without knowing the time scale, you’d probably think the Australian All Ordinaries market was always a wonderful place to invest. Sure, there have been dips along the way, but in the overall scheme, it looks like a never-ending rise.

Then when you’re told the graph spans almost 140 years, a personal timeframe becomes more relevant. If it’s true, as the United Nations has said, that the first person to live to 150 is already alive, then that person should happily invest 100% of their retirement savings into equities, and it would probably be the best asset allocation possible.

Since 1875 there have been 14 stock market cycles in Australia, where a cycle is defined as a fall in the nominal price index for the broad market of at least 20% from the previous top. Please note there is a lot of detail in the following two graphs, and they are best viewed enlarged on your screen. The graphs require a number of assumptions relating to ‘old data’, as explained at the end of this article, and I am indebted to my close colleague, Ashley Owen of Philo Capital Advisers, for the graphs.

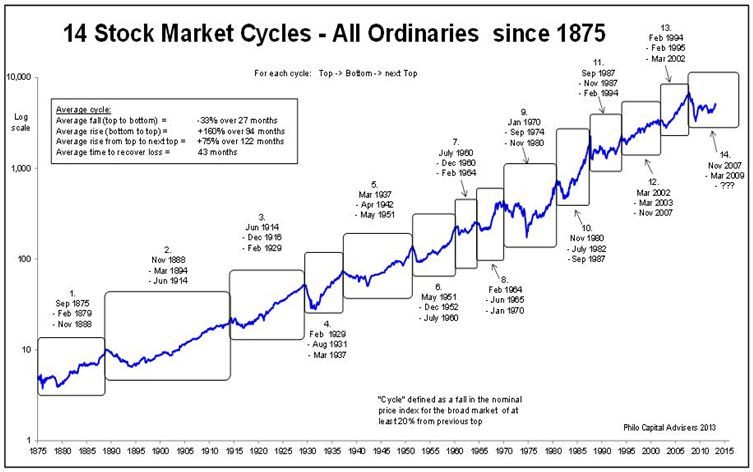
The interesting statistics from this graph are:

  • the average fall from top to bottom is 33% over 27 months
  • the average rise from bottom to top is 160% over 94 months
  • the average time to recover the loss after a new bottom is 43 months.

For me, the 43 months is the most important number. Even after a fall of 20% or more, the market recovers to the previous high on average in less than four years. In a world where investors should expect to be retired for 30 years or more, we should have greater tolerance of short-term volatility.

This has crucial policy implications. Many of the MySuper funds being designed now as part of Stronger Super will adopt ‘lifecycle’ principles, with less allocated to equities over time. For example, Colonial First State will reduce the equity component from 90% at age 50 to 40% by age 60. Investors and advisers need to decide if that is too much too soon.

Of course, falls and recovery can be much worse than the average, and losing money just before retirement can be very stressful. The following chart shows a level of 100 at the bottom of each cycle, and the pattern of recovery from there. The variation is significant, which is one reason why comparing just one cycle to one other is problematic (again, best viewed enlarged on a screen).

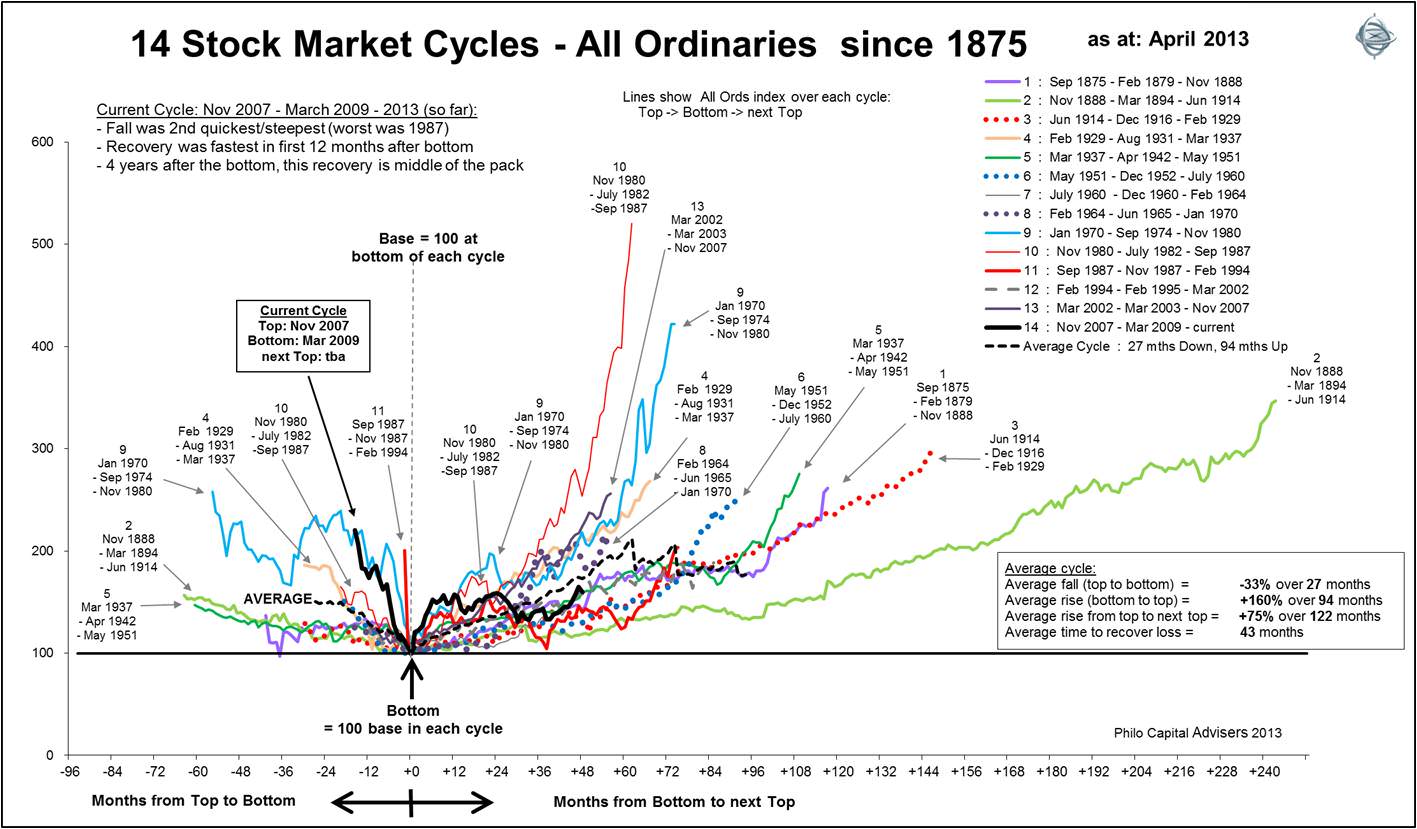
The current cycle we are in (the solid black line in the graph), commencing from the high point of November 2007 to the low point of March 2009, was the second fastest fall on record, after 1987. If it felt like an extreme experience of wealth destruction, it was - even if you have been around as long as Mr Storm. But the recovery was the largest in the first 12 months after the bottom. Four years after the commencement of the recovery in March 2009, the current increase is in the middle of the pack compared to all the past cycles.

Cuffelinks is not in the business of forecasting markets, but if the average rise from bottom to top is 94 months, and we are about 50 months into the current one, then there’s little from history to suggest it should run out soon. But every period is unique and has its headwinds and tailwinds to contend with.

Mr Storm would probably ask why are you worried about a few years here and there, young man?

Some qualifications regarding old data:

  • before 1979 the Sydney All Ords Index is used as a proxy for the ‘Australian’ index, but for most of the period Sydney was not the largest exchange by value or volume
  • before 1936 the reconstructed ‘Aust All Ords Index’ uses the ‘Commercial & Industrial Index’ which didn’t include banks or miners, which were the largest stocks by market value and volumes
  • before 1958, the sectors were equal weighted not market cap weighted
  • before 1979 the index didn’t include speculative stocks – not even the large / heavily traded ones  – eg Poseidon, Western Mining, MIM, Hamersley, Woodsreef, VAM, Harbourside Oil, etc.
  • war-time controls on share prices and profits (1942-49).

The pre-1979 index data probably significantly over-estimates returns, and under-estimates swings. If it were a true market value weighted index of all (or even all major) stocks, it would probably be very different – higher booms and deeper crashes – particularly in:

  • late 1880s silver mining boom, then 1890s collapse
  • 1890s banking crash / depression
  • 1929-31 crash
  • 1939-42 collapse of gold miners
  • 1968-70 mining boom then crash in 1970-71.


1 Comments
Peter Vann
April 26, 2013

Yes, one should “look towards your investment horizon”. Unfortunately many people don’t have the wisdom of Mr Storm; it seems that he realised there is a balance between the long term goal and short term noise.

A colleague and I are finalising a White Paper titled “Impact of Investment Risk on Retirement Funding” where, as the title suggests, we incorporate investment risk (as well as returns) when estimating a range of retirement outcomes, ie we use a stochastic return model. We show that investment risk has a big impact on retirement funding (not unexpected), and this impact varies significantly according to member circumstances.

There are many cases where more investment risk improves the likelihood of obtaining a target retirement income, ie it lowers your retirement funding risk, and there are cases where the opposite occurs. Even at the point of retirement, lowering your investment risk too far decreases the level of possible retirement incomes. I suspect that quite a few “lifecycle” strategies are too conservative too early resulting in a lowering of the likely range of sustainable retirement incomes, but the product guys need a marketing angle.

A corollary of our results is that the simple deterministic retirement income calculators are quite misleading as they do not incorporate the impact of investment risk; many calculators on Super Fund web sites, and indeed ASIC’s MoneySmart calculator, fall into this trap.


Leave a Comment:

RELATED ARTICLES

A one-page introduction to investing

Four key wealth drivers affecting long-term investment goals

Australian large caps outperform small caps over long term

banner

Most viewed in recent weeks

Which generation had it toughest?

Each generation believes its economic challenges were uniquely tough - but what does the data say? A closer look reveals a more nuanced, complex story behind the generational hardship debate. 

Raising the GST to 15%

Treasurer Jim Chalmers aims to tackle tax reform but faces challenges. Previous reviews struggled due to political sensitivities, highlighting the need for comprehensive and politically feasible change.

100 Aussies: seven charts on who earns, pays, and owns

The Labor government is talking up tax reform to lift Australia’s ailing economic growth. Before any changes are made, it’s important to know who pays tax, who owns assets, and how much people have in their super for retirement.

The best way to get rich and retire early

This goes through the different options including shares, property and business ownership and declares a winner, as well as outlining the mindset needed to earn enough to never have to work again.

A perfect storm for housing affordability in Australia

Everyone has a theory as to why housing in Australia is so expensive. There are a lot of different factors at play, from skewed migration patterns to banking trends and housing's status as a national obsession.

Chinese steel - building a Sydney Harbour Bridge every 10 minutes

China's steel production, equivalent to building one Sydney Harbour Bridge every 10 minutes, has driven Australia's economic growth. With China's slowdown, what does this mean for Australia's economy and investments?

Latest Updates

Retirement

Supercharging the ‘4% rule’ to ensure a richer retirement

The creator of the 4% rule for retirement withdrawals, Bill Bengen, has written a new book outlining fresh strategies to outlive your money, including holding fewer stocks in early retirement before increasing allocations.

Shares

Are franking credits worth pursuing?

Are franking credits factored into share prices? The data suggests they're probably not, and there are certain types of stocks that offer higher franking credits as well as the prospect for higher returns.

Retirement

Inflation cruels a comfortable retirement

ASFA’s latest estimates reveal that home-owning couples need at least $690,000 in super for a ‘comfortable’ retirement, yet only around 30% of people meet these thresholds, and the shortfall may deepen.

Australia’s sleepwalk into a damaged society

The role of family and community as foundations of a healthy society have been allowed to weaken. This has brought about Australia's spiritual decline and a thirst for dopamine that explains our high debt levels.

Investment strategies

The simplicity of this investing method hides its power

Despite the perception that successful investors nimbly navigate each zig and zag in the market, the evidence suggests otherwise. This approach can help an investor avoid self-harming their returns.

Investment strategies

Four ways that global investors are reshaping their US exposure

It wasn't long ago that investors were asking if US exceptionalism could continue. They now appear to be diversifying away from dollar assets and shifting to a more active US equity allocation.

Investment strategies

The case for high yield bonds

This is a primer on high yield bonds - their risk and returns compared to investment grade securities, diversification benefits, and strategies for selecting high yield investments for enhanced portfolio yields.

Sponsors

Alliances

© 2025 Morningstar, Inc. All rights reserved.

Disclaimer
The data, research and opinions provided here are for information purposes; are not an offer to buy or sell a security; and are not warranted to be correct, complete or accurate. Morningstar, its affiliates, and third-party content providers are not responsible for any investment decisions, damages or losses resulting from, or related to, the data and analyses or their use. To the extent any content is general advice, it has been prepared for clients of Morningstar Australasia Pty Ltd (ABN: 95 090 665 544, AFSL: 240892), without reference to your financial objectives, situation or needs. For more information refer to our Financial Services Guide. You should consider the advice in light of these matters and if applicable, the relevant Product Disclosure Statement before making any decision to invest. Past performance does not necessarily indicate a financial product’s future performance. To obtain advice tailored to your situation, contact a professional financial adviser. Articles are current as at date of publication.
This website contains information and opinions provided by third parties. Inclusion of this information does not necessarily represent Morningstar’s positions, strategies or opinions and should not be considered an endorsement by Morningstar.