With the 2017 Federal Budget targeting the profits of banks for a special levy, and questions about who’s next, let’s take a look at business profitability and shatter some myths. There are misunderstandings about excess profits that some well-intentioned but uninformed or envious people suggest are the norm, but aren’t.
There are thousands of good and truly impressive performers among our 840,000 employing-businesses in Australia. It’s a tiny minority indeed, but a minority we would surely all like to become more mainstream.
The business of business
Businesses are started for all sorts of reasons: to buy a job; to satisfy an entrepreneurial or freedom-seeking passion; or to make more money than in a job, via profits on top of a wage or salary. Most don’t achieve any of these. We currently have around 2.1 million businesses in Australia according to the ABS. Some 280,000 start up each year and nearly the same number close each year, mostly within three years of commencement. About 78% of businesses, on average, make a profit each year, 2% break even and 20% run at a loss. It’s tough.
The average profit of the businesses other than general government - in terms of the net return after tax on shareholder funds (ROSF) - has averaged just over 5% over the past 30 years, or about the same as the 10-year bond rate over the same period.
Surely it is much better among our big corporations, say the 1,500 biggest, accounting for around 42% of the nation’s revenue. Sadly, no. Over the past five years, their average has been just 8.7%, or much the same as the return on commercial property which is a passive asset. Some 20% of these 1,500 giants ran at a loss over the five-year period. Yes, one in five.
The 100 worst loss-making enterprises ranged from a five-year average ROSF of minus 16% pa to more than ten times that annual loss. The average over the 100 or so corporations was minus 44.7% pa, although slightly-less scary on a weighted average basis at minus 30.0%. These 100 negative earners were evenly split between foreign and local corporations. Almost one in five of the 100 were caught unprepared for the minerals prices collapse over this five-year period.
Of course, a number of them were investing heavily for the very long term and they could not be considered mismanaged.
Our 100 best government businesses, made up of Government Business Enterprises (GBEs) and general government organisations, fared a lot better, and had an average ROSF of 9.8% over the five years to 2016. Eleven of them achieved world best practice profitability of 20% or more. Around 80% of them bettered the average 10-year bond rate (3.1%) over this period. That’s no mean achievement for government enterprises, and half of the best 100 are listed below.
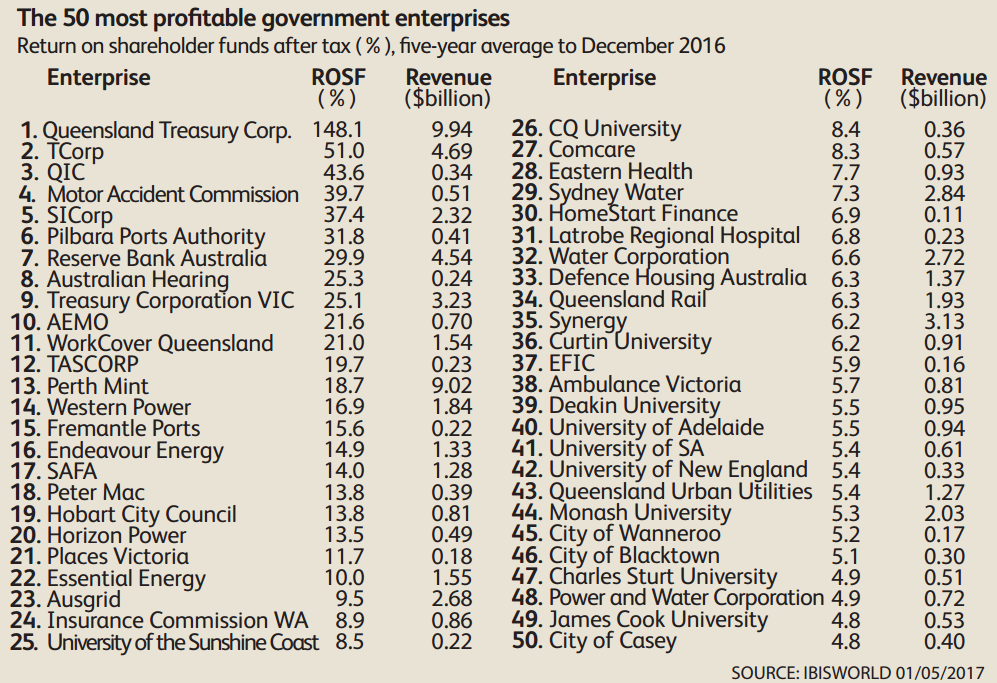
profitability
Performance of other clusters of companies
The 100 biggest corporations that account for just under one fifth (19%) of the nation’s revenue had an average ROSF of 11.6%, but only 8.4% on a weighted basis – also around the passive return on commercial property. Almost one in seven (18%) ran at a loss over the five-year period.
Cutting company taxes a bit wouldn’t improve this awful performance much. Why just get a 7% improvement to the bottom line by cutting the tax rate from 30% to 25%, when knowing how to achieve world’s best practice (WBP) profitability could double or even quadruple the bottom line, as well as the top line, profit.
Let’s look into serious territory where WBP profitability is common rather than scarce.
Our 100 best listed public companies on the ASX had an average ROSF of 23.3% over the five years to 2016. Some 47 of these had an average over 20%, matching WBP. Among those in the top 10 were: Tamawood (house construction), Platinum (funds management), Blackmores (vitamins), the Dulux Group (paint manufacture), Cochlear (hearing implants) and Telstra (telecommunications). These and a dozen others achieved over 30% in their returns on shareholder funds after tax over the five years to 2016.
The 100 best local private companies’ average ROSF, at 26.4%, was even better, not by a lot, but over half (53) did better than WBP over the five-year period. Names that are familiar to most include: Wotif; Lorna Jane; Penfolds Motors; Carpet Call; the GHD Group and Kennards Hire.
The 100 best foreign companies averaged a much higher 51.3% ROSF over five years, or double the 100 best public listed corporations and nearly double the 100 best privates. All 100 beat the cut-off for WBP profitability in ROSF terms at over 20%. There are a lot of well-known and household names in this list, including: Bechtel; Hilton International; FedEx; Diageo; Philips; Colgate Palmolive; Nestle and Apple.
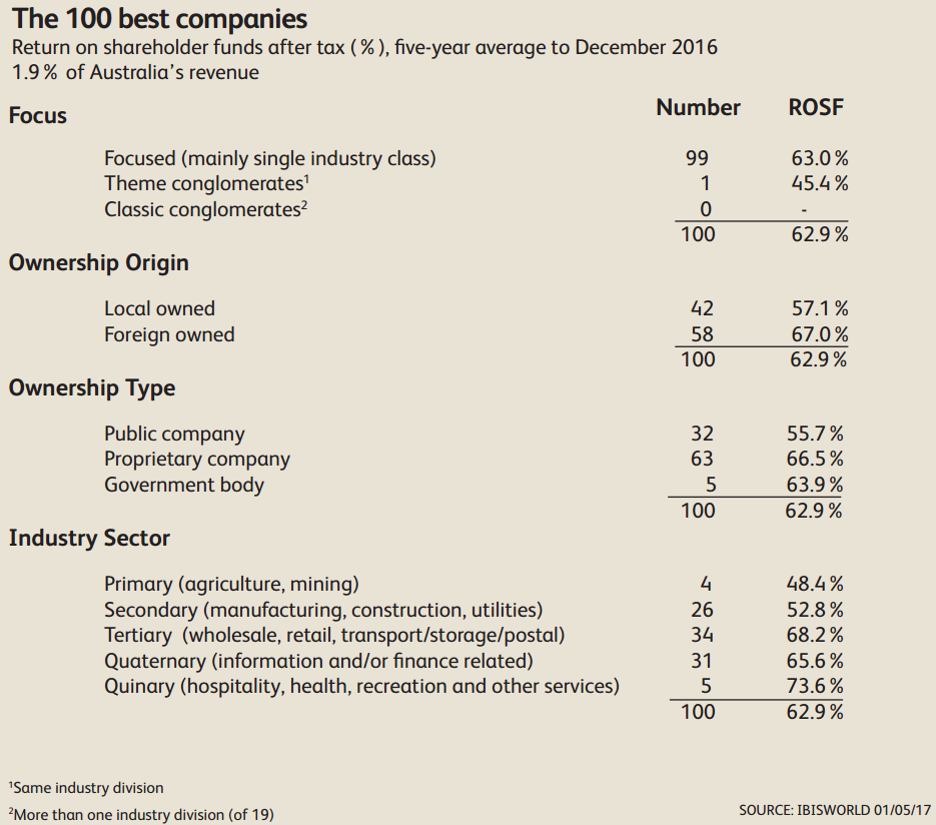
The 100 Best Companies over the five years, regardless of the type of company or ownership, saw the average ROSF jump to a staggering 62.9%. But the best 100 have averaged well over 30% for decades, without suggesting they have always been the same companies. That doesn’t happen: companies get taken over; split up or new management breaks the rules of success that got the company there in the first place.
Types of ownership do not matter much
What is particularly interesting about the outstanding performance of these companies is that there is very little difference in profitability between types of ownership, locality of ownership (local or foreign) or industries.
Indeed, when it comes to industries, they imply there is no such thing as a ‘bad’ industry, only inadequate or inappropriate management. In fact, three of the best 100 were in mining, whereas there were 18 miners in the 100 worst companies during a time when mineral prices plummeted. And there were 16 manufacturers in the best 100 list, an industry considered to be one of the toughest around these days.
The ladder below is an interesting one in this regard.
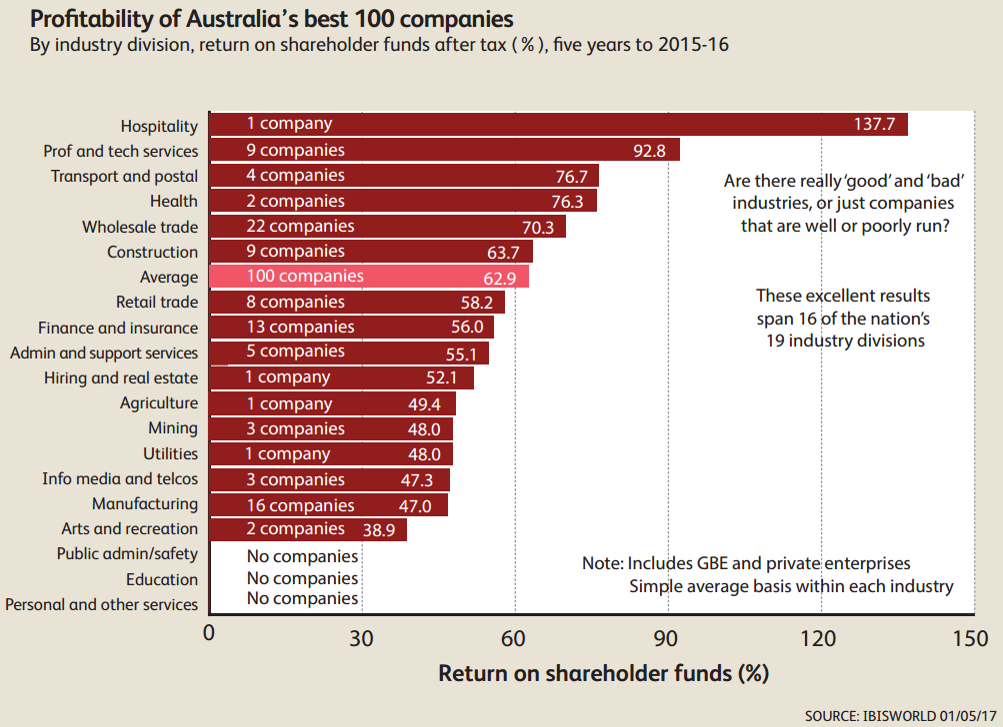
These returns are way above the entry level of WBP profitability of 20% ROSF where the winners are to be found, and should not be seen as the yardstick of success. Too few can ever achieve these best 100 levels, and it is not expected. Achieving 20%, consistently, will do just fine.
Phil Ruthven is Founder of IBISWorld and is recognised as one of Australia’s foremost business strategists and futurists.