Register For Our Mailing List

Register to receive our free weekly newsletter including editorials.

Home / 441

Morningstar asset class performance, 2021 and historical

The start of a new year is a good time to review portfolio performance and consider long-term settings for a financial future.

This article breaks Morningstar reporting into five tables to show market performance over all time periods to 30 years, as well as measures of risk and drawdowns. The chart on long-term performance shows Australian equities and listed property doing best since 1989. 

Table 1: Asset class performance from 1 month to 30 years

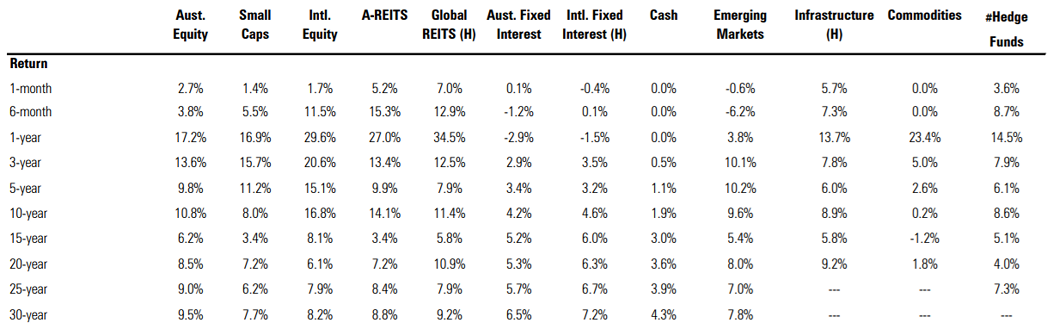
Table 2: Standard deviation (a measure of risk) by asset class

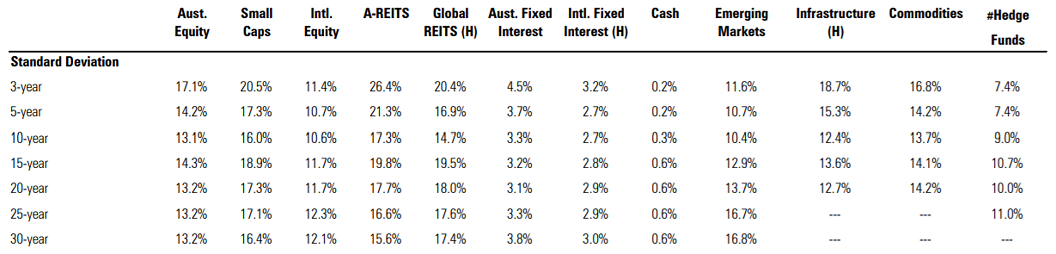
Table 3: Historical 1-year returns

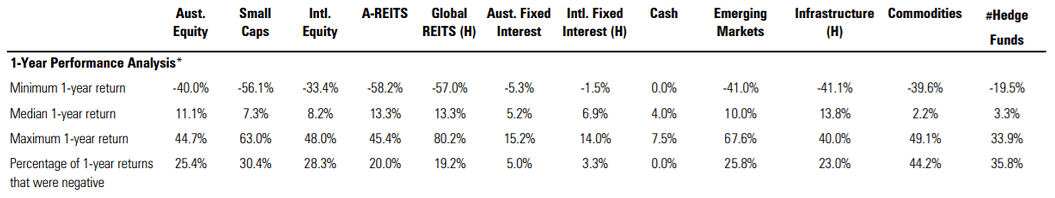
Table 4: Historical 5-year returns

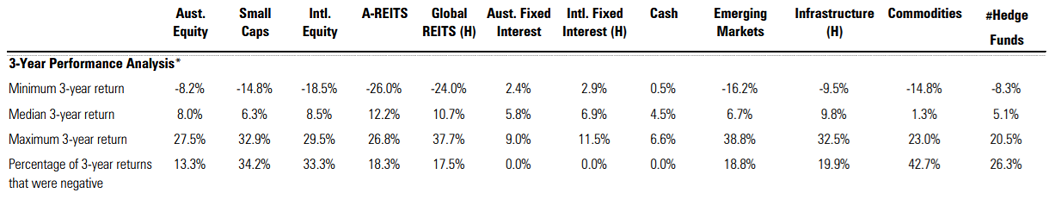
Table 5: Historical drawdown (market falls)

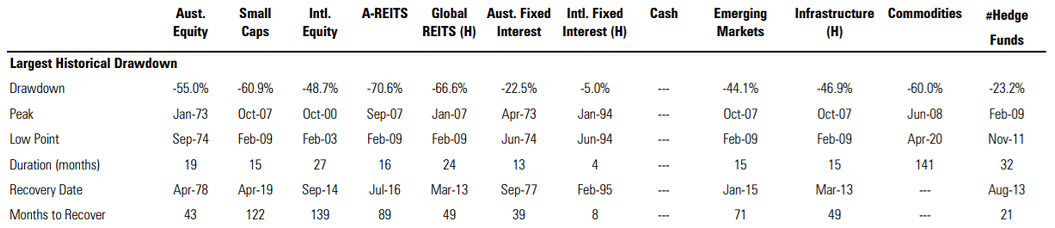
Tables sourced from Morningstar Adviser Research Centre.

Chart

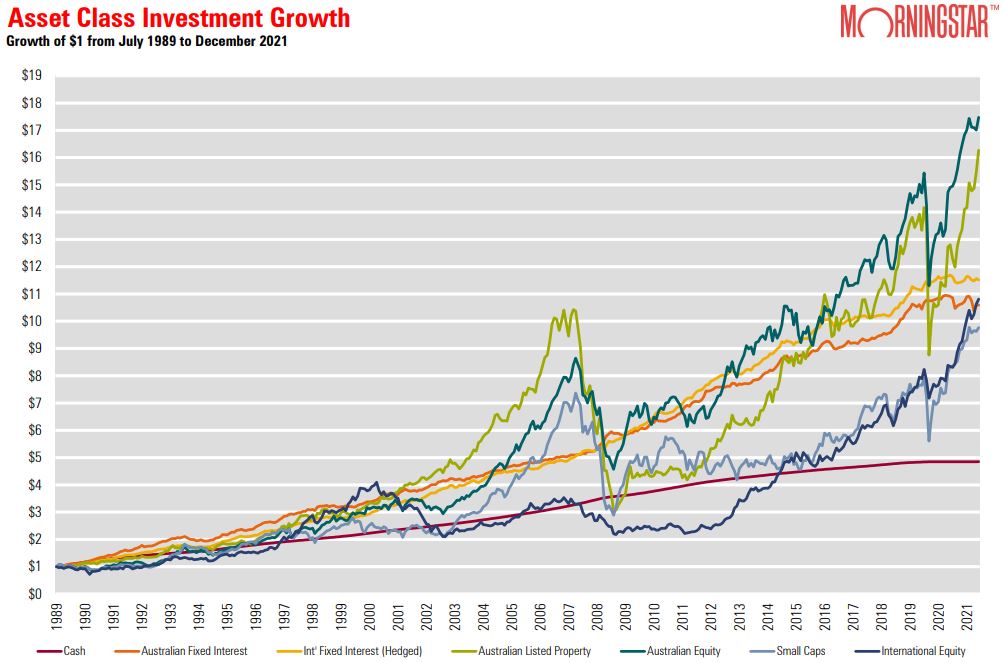
Source: Morningstar Adviser Research Centre.


Access data and research on over 40,000 securities through Morningstar Investor, as well as a portfolio manager integrated with Australia’s leading portfolio tracking service, Sharesight. Sign up to a free, four week trial below:


Try Morningstar Investor for free


5 Comments
Dudley
January 13, 2022

"with each of the asset classes ending up with $100 invested":

Better; then only need to time travel to make guaranteed outcome investments.

Tomorrow's race results are best.

Alexander Stitt
January 15, 2022

Wholeheartedly agree with John, that showing a common end point allows a much better understanding of where past performance differentials have arisen and overcomes the problem in the choice of start date; and I've long though this. A quick look at how different the results would be on the existing chart if the start date was 2006 vs 2009 easily illustrates the point. Maybe such a chart requires a bit more work from the user to comprehend, but is, in effect, just the tables of "past 1 years performance", "past 3 years performance", "past 10 years performance" put into a common chart with all time intervals on display all the way back to the chart start, not just the arbitrary "1 year", "3 year" "10 year" etc. observations.

I suspect Dudley, in his comment, did not fully understand what John was proposing.

Dudley
January 15, 2022

Been presenting semi-log cumulative total value normalised to 1 at current date for years.
More clearly shows relative growth rates.
Does not predict future.

D Ramsay
January 15, 2022

Could we please also get the modal values (i.e. mode = the most common score) into the Historical 1 and 5 -year returns into those tables please as it would give a perspective of how Normalized or Skewed the distribution is.


Leave a Comment:

RELATED ARTICLES

Diversification is not a free lunch

banner

Most viewed in recent weeks

Are LICs licked?

LICs are continuing to struggle with large discounts and frustrated investors are wondering whether it’s worth holding onto them. This explains why the next 6-12 months will be make or break for many LICs.

Retirement income expectations hit new highs

Younger Australians think they’ll need $100k a year in retirement - nearly double what current retirees spend. Expectations are rising fast, but are they realistic or just another case of lifestyle inflation?

5 charts every retiree must see…

Retirement can be daunting for Australians facing financial uncertainty. Understand your goals, longevity challenges, inflation impacts, market risks, and components of retirement income with these crucial charts.

Why super returns may be heading lower

Five mega trends point to risks of a more inflation prone and lower growth environment. This, along with rich market valuations, should constrain medium term superannuation returns to around 5% per annum.

The hidden property empire of Australia’s politicians

With rising home prices and falling affordability, political leaders preach reform. But asset disclosures show many are heavily invested in property - raising doubts about whose interests housing policy really protects.

Preparing for aged care

Whether for yourself or a family member, it’s never too early to start thinking about aged care. This looks at the best ways to plan ahead, as well as the changes coming to aged care from November 1 this year.

Latest Updates

Shares

Four best-ever charts for every adviser and investor

In any year since 1875, if you'd invested in the ASX, turned away and come back eight years later, your average return would be 120% with no negative periods. It's just one of the must-have stats that all investors should know.

Our experts on Jim Chalmers' super tax backdown

Labor has caved to pressure on key parts of the Division 296 tax, though also added some important nuances. Here are six experts’ views on the changes and what they mean for you.        

Superannuation

When you can withdraw your super

You can’t freely withdraw your super before 65. You need to meet certain legal conditions tied to your age, whether you’ve retired, or if you're using a transition to retirement option. 

Retirement

A national guide to concession entitlements

Navigating retirement concessions is unnecessarily complex. This outlines a new project to help older Australians find what they’re entitled to - quickly, clearly, and with less stress. 

Property

The psychology of REIT investing

Market shocks and rallies test every investor’s resolve. This explores practical strategies to stay grounded - resisting panic in downturns and FOMO in booms - while focusing on long-term returns. 

Fixed interest

Bonds are copping a bad rap

Bonds have had a tough few years and many investors are turning to other assets to diversify their portfolios. However, bonds can still play a valuable role as a source of income and risk mitigation.

Strategy

Is it time to fire the consultants?

The NSW government is cutting the use of consultants. Universities have also been criticized for relying on consultants as cover for restructuring plans. But are consultants really the problem they're made out to be?

Sponsors

Alliances

© 2025 Morningstar, Inc. All rights reserved.

Disclaimer
The data, research and opinions provided here are for information purposes; are not an offer to buy or sell a security; and are not warranted to be correct, complete or accurate. Morningstar, its affiliates, and third-party content providers are not responsible for any investment decisions, damages or losses resulting from, or related to, the data and analyses or their use. To the extent any content is general advice, it has been prepared for clients of Morningstar Australasia Pty Ltd (ABN: 95 090 665 544, AFSL: 240892), without reference to your financial objectives, situation or needs. For more information refer to our Financial Services Guide. You should consider the advice in light of these matters and if applicable, the relevant Product Disclosure Statement before making any decision to invest. Past performance does not necessarily indicate a financial product’s future performance. To obtain advice tailored to your situation, contact a professional financial adviser. Articles are current as at date of publication.
This website contains information and opinions provided by third parties. Inclusion of this information does not necessarily represent Morningstar’s positions, strategies or opinions and should not be considered an endorsement by Morningstar.