A little more than five years ago, we wrote about the migration towards passive investing in the US. We argued that “the shift from active to passive is warranted” and that passive investing “does not appear to be close to any kind of theoretical limit.” We also stated that the “continued flow from active to passive presents a contemporaneous risk to active performance” but “it increases the odds and risks of crowding and bubbles within passive strategies.”
There are still a number of benefits associated with passive investing, but we increasingly believe the next decade will be a more productive environment for active strategies. While this is somewhat self-serving from the perspective of an active manager, we will walk you through our rationale.
Why does passive investing ‘work’? And how passive is the market today?
The two major advantages of passive investment are low management fees and low transaction costs.
While a good active manager can arguably produce gross alpha in excess of management fees and transaction costs, if one views the market as a zero-sum game, it has to be that the average manager will underperform a nearly costless index by the sum of fees and transaction costs. Other advantages that are either investor-specific or debatable are tax efficiency, diversification, and eliminating behavioural biases (from which systematic strategies often attempt to profit).
Over time, these advantages have become so obvious that the US market has become extremely passive. In fact, we will argue that the US market is even more passive than conventional metrics would suggest. Figure 1 shows the largest 13F filers of Russell 1000 securities and our estimate of their active share.1 Only four of the top 10 (or top nine if we aggregate BlackRock) are “active” managers, as measured by having a significant active share. Three of those four even have a lower active share today than they did in 2017 (the exception being Wellington, whose active share increased from 43.7% to 44.8%).
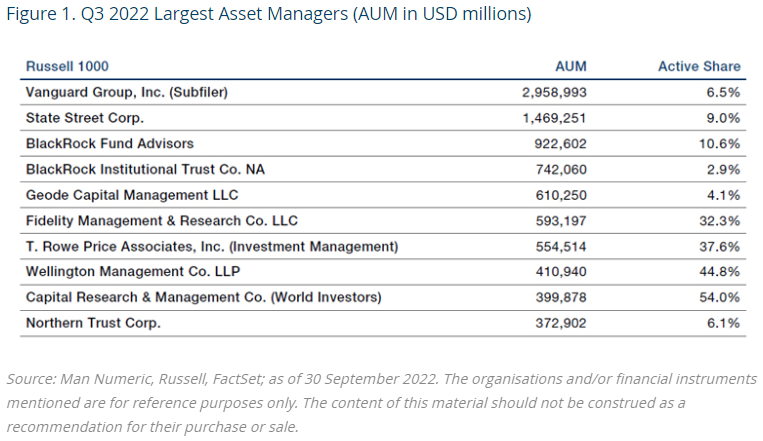
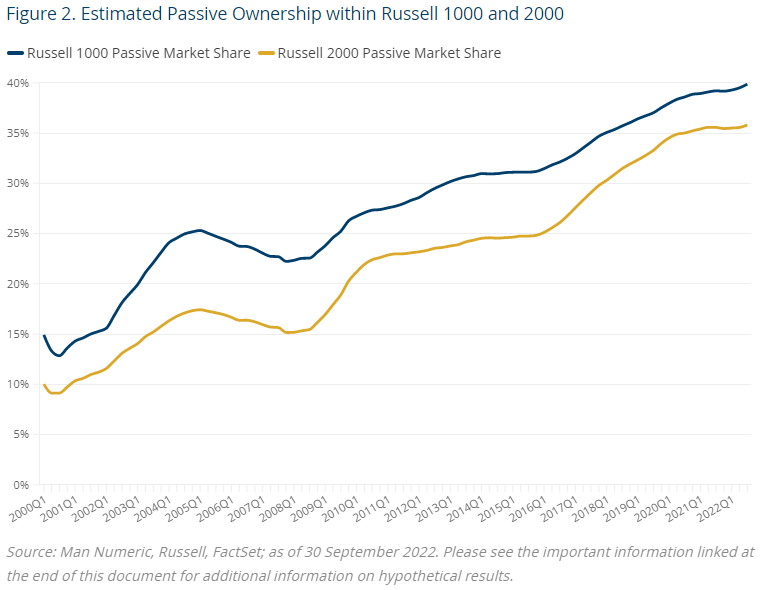
Figure 2 shows the estimated passive ownership within the Russell 1000 and Russell 2000 over time. We characterise a 13F filer as active (passive) if their active share is above (below) 20%. Note that among 13F filers, we currently estimate that 40% is held by passive investors.
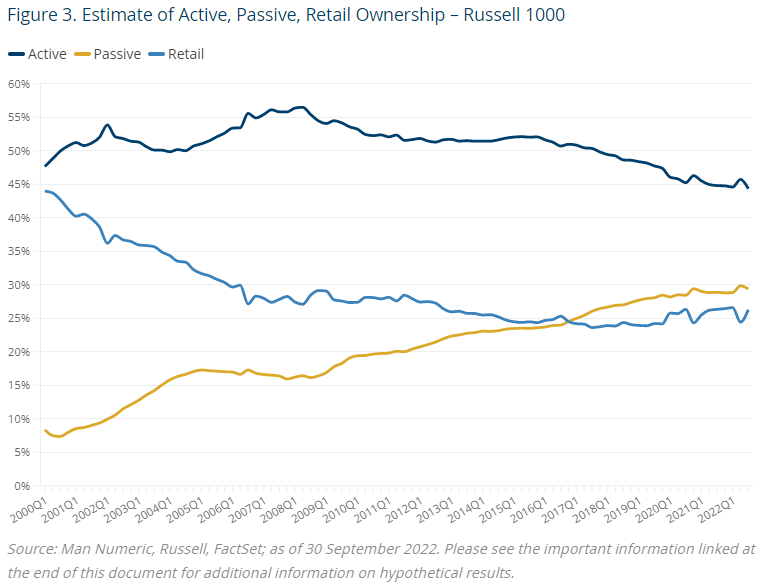
One issue with focusing on 13Fs is it ignores retail holdings.2 We can include an estimate of retail ownership of any company as shares outstanding of a company less what is held across all 13Fs.3 Figure 3 incorporates our estimate of retail ownership across the Russell 1000, and we now get a less aggressive estimate of passive ownership (~30% rather than ~40%). This might suggest that there is further room for the migration to passive investing, and while we would concede that point, there is an attenuating circumstance.
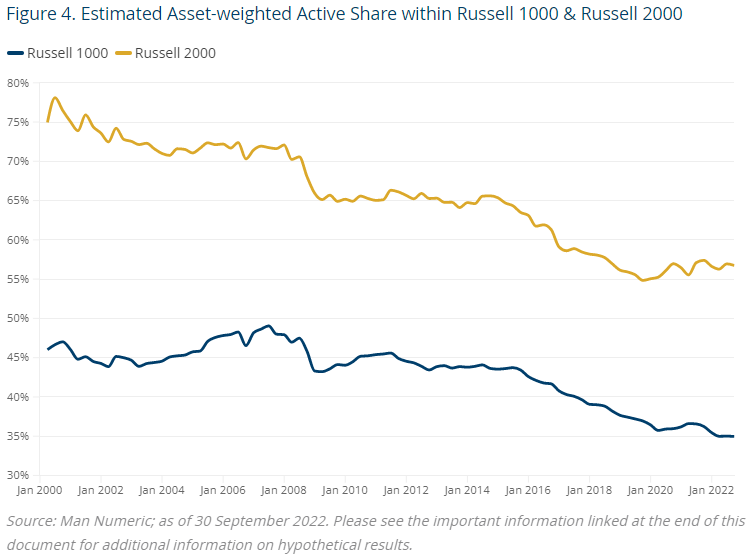
One of the issues with classifying 13F filers as active or passive is that it is quite a blunt distinction. What do we do with active managers that have become increasingly benchmark-oriented due to tracking-error considerations? To address this, we introduced the concept of asset-weighted active share to account for changes in benchmark-hugging across the entire market. Figure 4 shows this across both the Russell 1000 and Russell 2000. In the Russell 1000, our estimate of asset-weighted active share has fallen from nearly 50% to 35%, including a material drop over the past five years. Simply put, this means that only one out of every three dollars (held by institutions) deviates from a cap-weighted benchmark. So, while we have previously estimated passive “market share” at 40% or 30% in Figures 2 and 3, this view provocatively suggests that the US equity market might actually be two-thirds passive.
The US market has become increasingly passive, for a lot of good reasons, and we are not making an argument that this will (or should) reverse. However, conditions today do warrant another look at active investing.
What has changed so active investing may recover?
Let us start with the two clearest benefits of passive investing: very low fees and transaction costs. Passive fees have always been very low on a relative basis, and over the past decade have fallen to near zero for virtually everyone (and possibly zero or slightly negative in certain situations). Sadly, while there are sources for mutual-fund pricing (that show steep declines over the past two decades), we do not know of a good source of institutional management fees over time across the active space.
That being said, active management fees in the US (and globally) have fallen quite substantially over the past two decades. Let us suppose, for the sake of discussion, that 20 years ago active management fees for US equities were 0.5% to 1%, and today are closer to 0.2% to 0.4%.4 The main point of this supposition is that in a zero-sum game, 50 to 100 basis points (bps) of fees is a significantly higher hurdle than 20 to 40 bps, and this increases the viability of active management from a client value-add perspective.
Transaction costs can vary significantly over time and across regions. Typically, small-caps and emerging-market equities would be more expensive to trade than large-caps and developed-market equities. Let us assume that a US large-cap equity trade will cost 10 bps to trade (one can certainly do better or worse than this). The difference in costs between $0.15 of trades and $1.50 of trades is 13.5 bps. This is another hurdle that the active manager must overcome, and the higher the turnover, the higher the hurdle. But it should be noted that transaction costs in most equity markets have fallen due to increased liquidity, meaning that this hurdle has likely diminished over time.
We have talked about direct costs associated with active investing (relative to passive investing), but what indirect advantage has passive had over the past few decades that is unlikely to repeat over the next decade or two? Over the past few decades, several trillion dollars has likely moved from active to passive strategies. Morningstar estimates that in 2021, active US equity mutual funds had net outflows of $195 billion, while passive funds had net inflows of $346 billion.5 This would indicate that on a typical day, there was a net flow advantage of $2 billion for passive funds that are buying stocks solely based on market capitalisation!
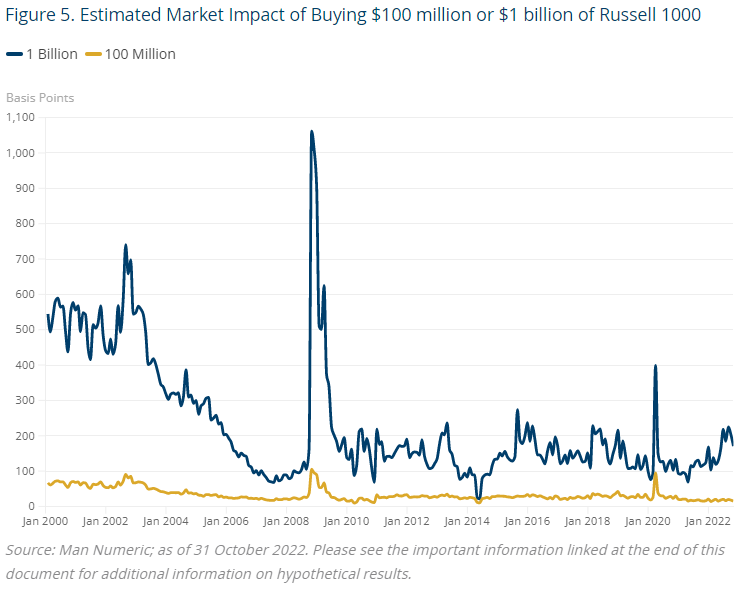
Figure 5 shows our estimated impact (in basis points) of buying either $100 million or $1 billion in the Russell 1000 over time. As liquidity has improved, over the past decade the rough range of estimated impact has been 15 to 20 bps and 100 to 200 bps for $100 million and $1 billion, respectively. To the extent that there has been serial and one-sided flow going from active to passive managers, this presents a range of potential impact that may contemporaneously advantage passive performance at the expense of active performance.
Besides explicit costs and what we believe to be a material headwind from a flow perspective, there is the nature of cyclicality in returns. Cyclicality appears to be a feature of many types of strategies (including passive) and, relating to the prior discussion on market impact, good performance tends to lead to positive flows, which can then lead to too many assets in a particular strategy, which can then lead to underperformance.
Do we see any evidence of cyclicality within active-versus-passive performance and, if so, where are we today? Using the eVestment database, we analysed the relative gross of fee6 performance of US active large-cap managers, and then separated by both (self-described) quantitative and fundamental groups.
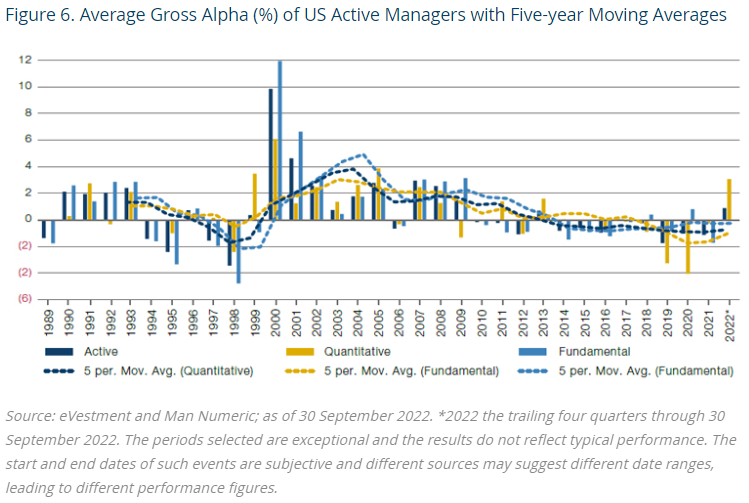
Figure 6 shows the annual gross relative performance of active, quantitative, and fundamental managers, as well as the five-year moving average. We should mention that we have equal-weighted and not asset-weighted these calculations as the assets data are unfortunately sparser. We also believe that asset weighting would likely lower the typical outperformance that is represented below. We believe the data below suggest some interesting observations. It does appear there is some cyclicality in active performance, as the periods from 1990 to 1993 and 2000 to 2008 appear quite productive for active managers, while the periods from 1994 to 1999 and 2010 to 2021 are more challenging.
As an additional data point, the annual autocorrelation of active manager performance is 40% over this period. We can also see that 2019 and 2020 were extraordinarily challenging for quantitative managers – in fact, they were the two most difficult years over this 30-year period. But conditions have improved over the past two years, and we would like to think this augurs well for the cyclical prospects of active managers.
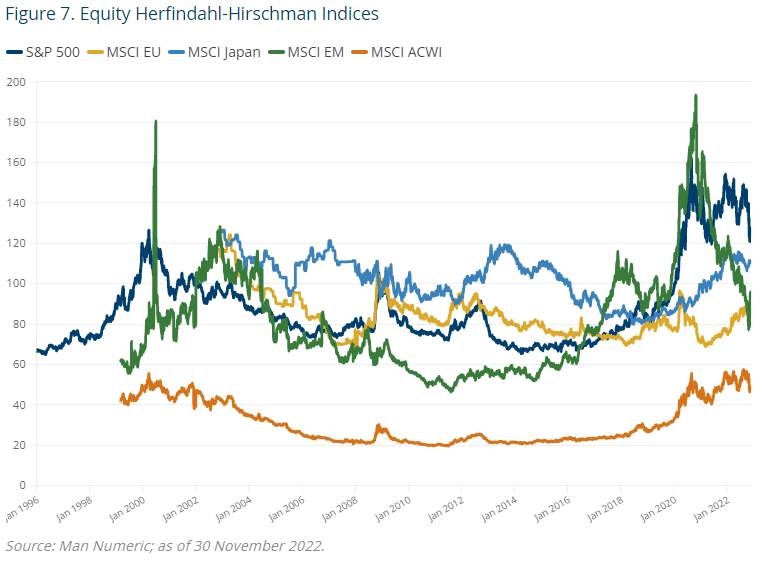
Furthermore, if we look at the concentration of equity indices globally through a Herfindahl-Hirschman Index, we can see that the cyclical underperformance within US equities coincides quite nicely with increasing concentration (Figure 7). Globally, while concentration has fallen quite materially within MSCI Emerging Markets, concentration still sits near highs in the US, Europe, Japan, and All Country World indices.
What are the broader implications for global equity investing?
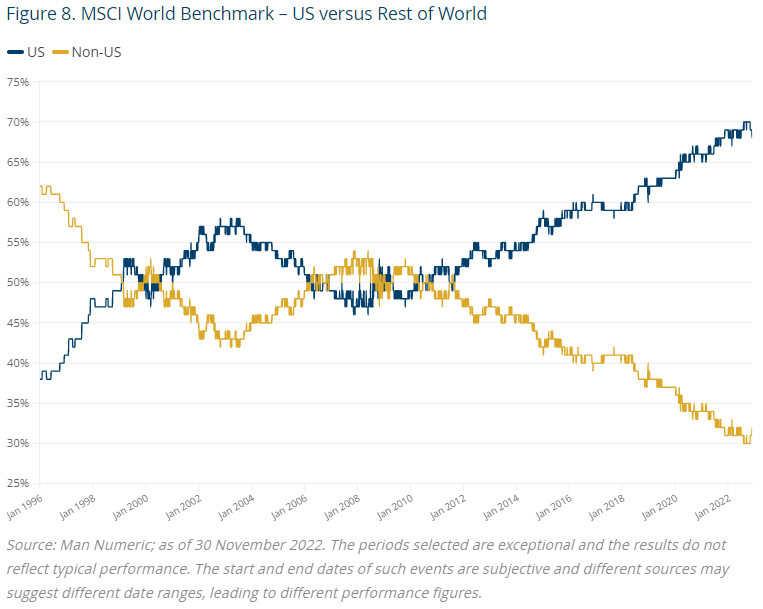
While we have focused on active and passive investing in the US, we do believe that many of the observations here are relevant outside the US. But even if that were not the case, and this was only a US phenomenon, global equity indices are now heavily dominated by the US. Today, the US represents 70% of the MSCI World index (Figure 8) and has steadily risen over the past dozen years. Is it a coincidence that this has occurred during a period of increased passivity and increased concentration with the US equity market?
Where is the equilibrium between active and passive strategies?
So why do we believe now is a good time to start revisiting active investment strategies in the US? We will highlight three points:
- Active fees and transaction costs have declined over time and because the spread between active and passive has shrunk along this dimension, the hurdle for active strategies to add value is as low as it has ever been.
- The massive flows from active to passive strategies have been a significant headwind to active strategies and a tailwind to passive strategies. While those flows may continue, we believe we are approaching an upper limit to the passivity of the market, and thus this headwind is likely to abate.
- Active relative performance appears to exhibit cyclicality (as do many investment styles), and active managers recently went through a prolonged period of difficult performance that may have started to reverse. We also note the US had a bull market of nearly a dozen years that was barely interrupted by the onset of Covid. Passive may have disproportionately benefited from the continual bouts of quantitative easing, when the best strategy was simply to own the market and buy the dips. A different environment may call for more discretion and less complacency among equity investors.
1. Note that we are looking at the sub-filer level, so for example BlackRock has multiple entities, some of which do not appear here.
2. For further analysis of retail investors, please see our April 2022 paper “Active, Passive, Retail, ESG and Value; Oh My!”
3. Note this is imperfect because of short selling, where total shares held exceed shares outstanding.
4. Of course, fees generally depend on a number of considerations, including but not limited to universe, tracking error, and mandate size.
5. www.morningstar.com/articles/1075161/us-fund-flows-smashed-records-in-2021
6. Managers report gross performance here so it would still be important to consider the impact of management fees.
Daniel Taylor, CFA is CIO, Man Numeric. Man Group is a specialist investment manager partner of GSFM Funds Management, a sponsor of Firstlinks. GSFM represents Man AHL and Man GLG in Australia. The information included in this article is provided for informational purposes only. Munro Partners do not represent that this information is accurate and complete, and it should not be relied upon as such. Any opinions expressed in this material reflect our judgment at this date, are subject to change and should not be relied upon as the basis of your investment decisions.
For more articles and papers from GSFM and partners, click here.