Register For Our Mailing List

Register to receive our free weekly newsletter including editorials.

Home / 581

Portfolio construction in the real world

Building an investment portfolio is akin to building or renovating a house. You have a dream home in mind, but there are practical issues to consider - budget, compliance, design and construction challenges. You may love the dream, but those are real-world parameters you can’t ignore.

Similarly, if you want your investment portfolio to help you achieve your goals in life, you need to keep a whole range of variables and often opposing practicalities in mind.

This article presents a framework for thinking about these challenges, using the interplay between risk, return, time horizon and the likelihood of negative returns for different asset allocation profiles.

The analysis is based on 30 years of rolling monthly returns to 30 June 2024, and incorporates the most common asset allocation profiles we use among our clients. These various growth/defensive portfolio splits are 60/40, 75/25 and 85/15. 

This is important because your decision on asset allocation, specifically the mix of growth and defensive assets, is pivotal. In fact, it can drive 94% of your return - according to the often-cited 1986 study “Determinants of Portfolio Performance” by Brinson, Hood and Beebower.

So let’s get into the detail and look at how these different allocations work.

Asset allocation profiles

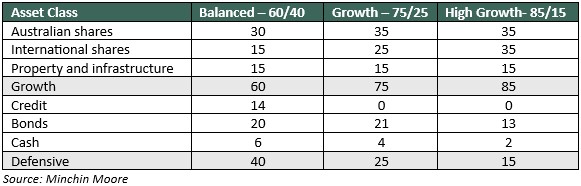
Each asset class here has a specific role to play relative to the portfolio objective. For example, the Balanced portfolio is typically more appropriate for those in need of cashflow – hence the greater allocation to shorter duration, floating rate credit and cash.

Conversely, the High Growth portfolio is built to deliver capital growth, and therefore its defensive portion is designed to protect against equity market volatility.

Controlling the controllable

Markets are inherently uncertain and none of us has a crystal ball. For all the pundits forecasting the trajectory for interest rates or the impact of the US election on markets, there are others who admit they know what they don’t know, accept the uncertainty and focus on the controllables.

One thing you can control is building an efficient and durable portfolio – one that is based on sound investment principles; one that is aligned to your objectives, horizon and risk appetite; and one designed to give you the best chance of meeting your goals while controlling for risk along the way.

Diversification across asset classes is foundational to this approach. It will not only determine your return but will allow you to minimise volatility.

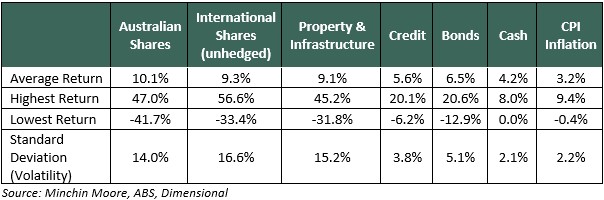
The table below shows the returns and risk of key asset classes over the same 30-year period (included as a reference point relative to risk/return for the asset class profiles).

The risk-return relationship

The relationship between return and risk should be your starting point. To achieve higher returns, you need to take on greater risk. To take on more risk, you need more time.

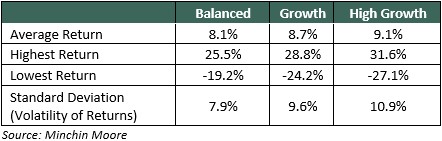
To demonstrate this, look at the table below, which references rolling monthly annual returns. As expected, the returns increase incrementally from left to right. So far, so good. But note:

Relative to the volatility shown in the table above, the asset class profiles have meaningfully less volatility than the growth asset classes (shares, property and infrastructure). For example, High Growth returns slightly lag Australian shares (9.1% v 10.1%), but it delivers a material reduction in volatility (10.9% v 14%). That is the power of diversification. 

Note also that the increase in standard deviation (the volatility of returns) is relatively more than the increase in return as you move from Balanced to Growth to High Growth. In other words, the relationship between return and risk is non-linear.

To show this another way, let’s look at the “efficient frontier”.

The chart below plots a series of portfolios from those with less expected risk/volatility (and therefore lower expected returns) to those with a greater allocation to growth assets such as the 85/15 portfolio, which exhibit higher returns and greater risk. Optimal portfolios sit on the curve (the frontier) and are optimised to maximise expected return for a given level of risk or conversely, minimise risk for a given level of expected return.


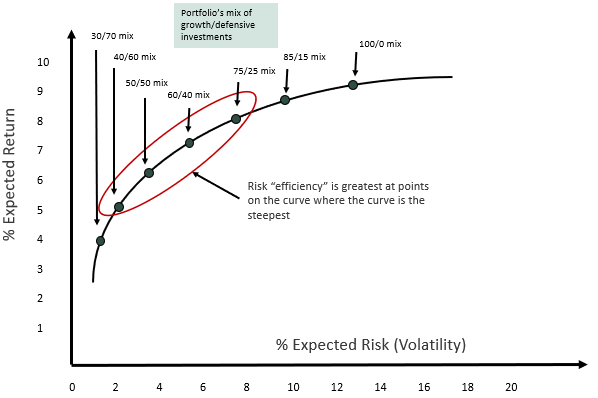
Note: Not to scale, for illustrative purposes only

You can see that risk “efficiency” is greatest where the curve is the steepest. Here, you expect relatively higher return for taking on incremental risk. But as the curve flattens out at a greater allocation to growth assets, the opposite occurs – you need to take on relatively more risk for incremental return.

This means finding that optimal mix is an important consideration. It influences not only headline returns, but the amount of risk required to achieve those returns. Yes, taking on additional risk beyond the 75/25 portfolio brings additional return, but it comes at a price.

Time is of the essence

Your time horizon and allocation to growth assets are directly correlated. For a growth objective, you need more time for the portfolio to withstand inevitable volatility. The higher the allocation to growth assets, the more probable there will be extended periods of negative returns.

The table below shows the maximum, minimum and average return for the rolling monthly data series – across different periods and asset allocation profiles. It also shows the likelihood of a negative return over those periods.

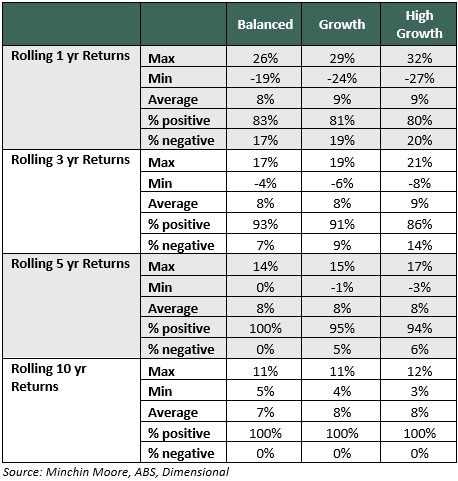
Note there are zero instances of negative returns over a 10-year time period for all asset allocation profiles. Over a shorter period, there is a marked difference between the profiles – the likelihood of a negative return for High Growth over three years (14%) is double the Balanced profile (7%).

Two key lessons here: First, your time horizon matters. Time allows portfolios to grow and compound. During drawdowns, time allows portfolios to recover. The deeper the drawdown, which is directly correlated to the allocation to growth assets, the more time it needs to recover.

Second, discipline matters. Our experience is the trauma of sustained negative periods can encourage emotional and counter-productive decisions among some investors. But those armed with discipline and a well-constructed investment framework are better equipped to weather the storm.

Conclusion

Building a portfolio is like building a house. You need a framework that starts with clarity on your goals, time horizon and risk tolerance.

  • Construct a portfolio with the right growth/defensive mix relative to that plan. Don’t ignore risk – you can give up some return and dampen volatility meaningfully by diversifying across asset classes.
  • Focus on the controllables – the plan itself, diversification, and keeping your costs down. Focus more on what you know (as opposed to what you think might happen) and what this historical data tells you.
  • Discipline matters. The investing concepts here are straightforward. Keeping your nerve is the hard part - don’t be distracted and let your emotions overrule the plan.


Jamie Wickham, CFA is a Partner at Minchin Moore Private Wealth and former managing director, Morningstar Australia.


14 Comments
Joe
October 11, 2024

So, risk = volatility?

A R
October 13, 2024

I consider risk and volatility as being different things. Consider being invested in mostly cash for a long period. Its low volatility, but has high risk of poor overall performance and not meeting investment goals.

SMSF Trustee
October 13, 2024

So they're not different things. Volatility is a measure of one kind, or concept, of risk. That is the risk that, over any particular period, the value of your investment has gone backwards in nominal terms. That risk is negligible with cash, but very real with equities where you could wake up to a new GFC and find your portfolio is lower by 20% or more.
The risk of not achieving a long term investment growth expectation is a different concept of risk. It's arguably more important, but harder to quantify. Doesn't mean volatility isn't a risk.

Dudley
October 13, 2024

"not meeting investment goals":

When goal met, such as more than enough until death, then no need to take risks.

(Age Pension) + (Real earnings on Asset Test full pension capital) + (Real annual capital gain on home)
= (26 * 1725.2) + PMT((1 + 5%) / (1 + 3%) - 1, (97 - 67), -470000, 470000) + (((1 + 5%) / (1 + 3%) - 1) * 1000000)
= $73,398.89 / y

Never Age Pension: same income as with full Age Pension:
= (PV((1 + 5%) / (1 + 3%) - 1, (97 - 67), 73,398.89, 1045500))
= -$2,244,285.85 (-=amount deposited in fund, including home)

James
October 13, 2024

Risk = consequence x chance.

The risk of a loss from equities is inversely proportional to the hold time.

Volatility is just the price you pay fro a seat at the table.

Joe
October 15, 2024

So if I need the money soon, it's risk, if I don't it's just volatility? That explains people becoming more conservative as they get closer to retirement.

James
October 15, 2024

"So if I need the money soon, it's risk, if I don't it's just volatility? That explains people becoming more conservative as they get closer to retirement."

It's sequence of return risk! Money needed in short to mid term: cash bucket or equivalent. Longer term, need to maintain/grow purchasing power to overcome inflation: equities or other asset growth vehicle or never quit you job!

Jamie Wickham
October 15, 2024

All good points here. The overarching risk for many investors will be the risk of not meeting their goals or objective. The intent of the article was to highlight the interplay between risk (in this case volatility or the variability of returns) and return for different asset allocation profiles; and the relationship with time horizon (the extent to which time allows a portfolio to recover). As pointed out volatility is the price you pay for investing in growth assets. The biggest risk is behavioural - the ability for investors to withstand those bouts of volatility - stick to the plan and block out the noise. The lesson is to be really thoughtful about your investment program and portfolio - one that will support your goals and one you can stick to.

Dudley
October 17, 2024

"overarching risk for many investors will be the risk of not meeting their goals or objective":

What it takes:

Real Future Value: ( Super earnings tax 15%, Super gross earnings 10%, inflation 3%, to 67 from 47, Super contribution tax 15%, contributors 2, concessional contribution max $30,000 / y ) + ( home equity 100% of $1,000,000 );
= ( FV((1 + (1 - 15%) * 10%) / (1 + 3%) - 1, MAX(0, (67 - 47)), (1 - 15%) * (2 * -30000), 0) ) + ( FV((1 + 5%) / (1 + 3%) - 1, (67 - 47), 0, -1000000) )
= $3,217,280.28

Real earnings when in Disbursement ('pension') mode: Home equity 100% of $1,000,000, Asset Test full pension capital $1,045,500;
= PMT((1 + 5%) / (1 + 3%) - 1, (87 - 67), -3217280.28, 1045500)
= $152,374.45 / y

Is:
. 10% gross earnings,
. $30,000 concessional contribution / y,
. $1,000,000 home equity
achievable?

YkmageWV.

Ryan G
October 11, 2024

Good data, thanks Jamie.

JohnS
October 11, 2024

Looking at the last table - two observations

1. It doesn't seem to matter much, the average returns of balanced, growth and high growth all seem to be approximately the same. so the obvious question is "why take on anything higher risk than balanced? (eg five year averages are all the same)

2. There seems to be something mathematically wrong with the figures. Surely the average of all one year average returns must be the same as the average of all ten year averages?

i would be interested in a response, and an explanation of where my assessments are incorrect

Johns
October 11, 2024

One further question.

Can you please provide the standard deviations for each ofnthe portfolios in the last table for each of the time periods

Barry
October 11, 2024

No, there is nothing wrong with the maths. The one year average returns can be quite different to the average 10 year returns if the last 12 month period was a very high returning or very low returning period compared to what the average was over the last 10 years. So they don’t all have to be the same.

Jamie Wickham
October 16, 2024

I will attempt to answer the questions above. A decimal place adds some precision to the table. 5 year average returns are 7.5%, 8.0%,8.1% for Balanced, Growth and High Growth respectively. For 10 years, the average returns numbers are 7.4%, 7.8%,7.8%. Whilst it is true that incremental returns are lower for each unit of additional risk at the higher allocation to growth assets, keep in mind there are some shifts in the asset allocation, which has an impact on returns for the different asset allocation profiles.

On the average of 1 year returns being higher than 10 year returns, the shorter time period can lead to a higher number. Typically, 1 year returns are positive 4 years out of 5, and more variable. Over 10 years and a longer timeframe, this variability narrows and the average returns more closely resemble the expected returns for these asset allocation profiles of CPI +3.5%, CPI +4% and CPI +4.25%. In that context, standard deviation for the 10 year returns (1.53%-2.42%) for the three asset allocation profiles is lower than the 5 year returns (2.9% to 4.4%) , which is lower again than the annual standard deviation in the risk/return table in the article. The variability of returns is narrower as the time horizon lengthens - as you would expect.


Leave a Comment:

RELATED ARTICLES

What Warren Buffett isn’t saying speaks volumes

When is the right time to pull the plug on an investment?

How to invest in funds for free (almost)

banner

Most viewed in recent weeks

Maybe it’s time to consider taxing the family home

Australia could unlock smarter investment and greater equity by reforming housing tax concessions. Rethinking exemptions on the family home could benefit most Australians, especially renters and owners of modest homes.

Supercharging the ‘4% rule’ to ensure a richer retirement

The creator of the 4% rule for retirement withdrawals, Bill Bengen, has written a new book outlining fresh strategies to outlive your money, including holding fewer stocks in early retirement before increasing allocations.

Simple maths says the AI investment boom ends badly

This AI cycle feels less like a revolution and more like a rerun. Just like fibre in 2000, shale in 2014, and cannabis in 2019, the technology or product is real but the capital cycle will be brutal. Investors beware.

Why we should follow Canada and cut migration

An explosion in low-skilled migration to Australia has depressed wages, killed productivity, and cut rental vacancy rates to near decades-lows. It’s time both sides of politics addressed the issue.

Are franking credits worth pursuing?

Are franking credits factored into share prices? The data suggests they're probably not, and there are certain types of stocks that offer higher franking credits as well as the prospect for higher returns.

Are LICs licked?

LICs are continuing to struggle with large discounts and frustrated investors are wondering whether it’s worth holding onto them. This explains why the next 6-12 months will be make or break for many LICs.

Latest Updates

A nation of landlords and fund managers

Super and housing dwarf every other asset class in Australia, and they’ve both become too big to fail. Can they continue to grow at current rates, and if so, what are the implications for the economy, work and markets?

Economy

The hidden property empire of Australia’s politicians

With rising home prices and falling affordability, political leaders preach reform. But asset disclosures show many are heavily invested in property - raising doubts about whose interests housing policy really protects.

Retirement

Retiring debt-free may not be the best strategy

Retiring with debt may have advantages. Maintaining a mortgage on the family home can provide a line of credit in retirement for flexibility, extra income, and a DIY reverse mortgage strategy.

Shares

Why the ASX is losing Its best companies

The ASX is shrinking not by accident, but by design. A governance model that rewards detachment over ownership is driving capital into private hands and weakening public markets.

Investment strategies

3 reasons the party in big tech stocks may be over

The AI boom has sparked investor euphoria, but under the surface, US big tech is showing cracks - slowing growth, surging capex, and fading dominance signal it's time to question conventional tech optimism.

Investment strategies

Resilience is the new alpha

Trade is now a strategic weapon, reshaping the investment landscape. In this environment, resilient companies - those capable of absorbing shocks and defending margins - are best positioned to outperform.

Shares

The DNA of long-term compounding machines

The next generation of wealth creation is likely to emerge from founder influenced firms that combine scalable models with long-term alignment. Four signs can alert investors to these companies before the crowds.

Sponsors

Alliances

© 2025 Morningstar, Inc. All rights reserved.

Disclaimer
The data, research and opinions provided here are for information purposes; are not an offer to buy or sell a security; and are not warranted to be correct, complete or accurate. Morningstar, its affiliates, and third-party content providers are not responsible for any investment decisions, damages or losses resulting from, or related to, the data and analyses or their use. To the extent any content is general advice, it has been prepared for clients of Morningstar Australasia Pty Ltd (ABN: 95 090 665 544, AFSL: 240892), without reference to your financial objectives, situation or needs. For more information refer to our Financial Services Guide. You should consider the advice in light of these matters and if applicable, the relevant Product Disclosure Statement before making any decision to invest. Past performance does not necessarily indicate a financial product’s future performance. To obtain advice tailored to your situation, contact a professional financial adviser. Articles are current as at date of publication.
This website contains information and opinions provided by third parties. Inclusion of this information does not necessarily represent Morningstar’s positions, strategies or opinions and should not be considered an endorsement by Morningstar.