The software bubble appears to have popped but not everyone seems convinced. Getting off the train can be difficult as buying the dip in software has generally worked over the past decade. A similar dynamic took place in the energy sector boom-and-bust cycle in 2014. In fact, looking back at that period, we find many lessons from the US shale boom that are broadly applicable to the recent software boom. At a high level, we think both industries are representative of the excesses of the last decade driven by easy capital, as well as the dangers of ignoring capital cycles.
There seems to be a new disruptive technology that gets the markets excited in every cycle. A decade ago, it was hydraulic fracturing (which we will refer to as shale). In recent years, it has been software. In both cases, the market initially encouraged growth at all costs, highlighting strong unit economics, and adjusted valuation metrics that made the industry look profitable and cheap.
Eventually, supply flooded into the sectors just as demand started to decelerate. As energy investors learned the hard way over the past decade, no sector is immune to the basic laws of supply and demand – including the technology sector.
Looking at the software industry today, market participants seem to be reconnecting with reality, but they seem to have mixed views over the depth and duration of the downturn as discussions have shifted to whether the worst is over. The median drawdown year-to-date of the 46 Russell 1000 software companies founded post-2000 has been 61% through November (see Exhibit 1). Despite the eye-popping drawdown, valuations remain an issue, in our view. The median company in this cohort still trades at 6.1x revenue. Only 22% of the cohort is GAAP profitable.
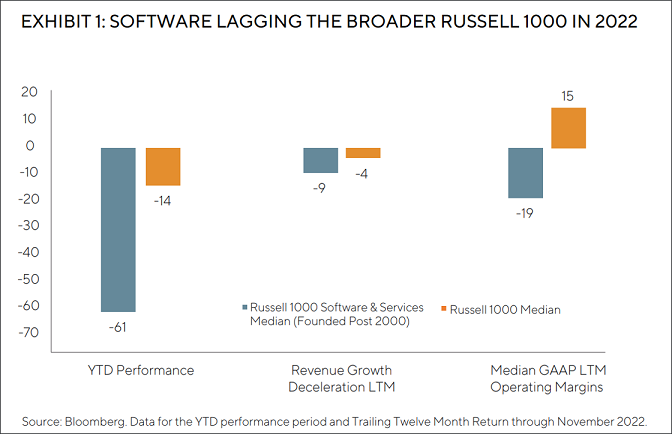
We see fundamental issues with the industry. Nearly every software company has demonstrated broad-based growth deceleration from 2021 levels – the Russell 1000 cohort from above has a median revenue growth deceleration of 9% over the last twelve months. The story sold during the go-go years of 2020 has not played out – as it turns out, not every software company will become the next Microsoft, and software has not eaten the world.
The harsh reality is that most of the newer software companies have not built sustainable business models. Despite much excitement and broader industry growth, these companies have not delivered meaningful profit growth.
The median GAAP LTM operating margin in the Russell 1000 cohort is still -19%. Many investors may quote free cash flow multiples, but the open secret has been most of this ‘free cash flow’ is actually share-based compensation that is highly dependent on share prices (which have melted). If these companies could not become profitable during a massive boom period with strong software demand, when will they? We believe the combination of abundant capital, low interest rates, and strong industry growth during the past decade has resulted in weak, unprofitable business models for a number of newer software firms.
To be clear, we have owned select cloud software businesses in the past before cutting back in late 2021, especially as we started seeing signs of deceleration and lack of margin improvement. We believe the continued decline in growth has supported our decision to exit those names. Ahead of a difficult 2023 backdrop where software demand seems to be weakening, we expect revenue growth to further decelerate, margins to further compress, and free cash flow to decline. In other words, a toxic mix for any investment.
Lessons from US shale – a classic capital cycle
The similarities
Both industries were considered secular growth stories despite operating within lower growth areas – oil as a 1-2% industry grower and information technology (IT) spend as a 4-5% grower. Excitement about a new technology was central to the investment case for both industries. In the case of US shale, engineering technology revolving around hydraulic fracking and horizontal well drilling allowed oil operators to access oil resources that were previously difficult to harvest at lower costs. In the case of software companies, the advent of cloud architecture and better internet infrastructure allowed easier deployment, iteration, and adoption of software.
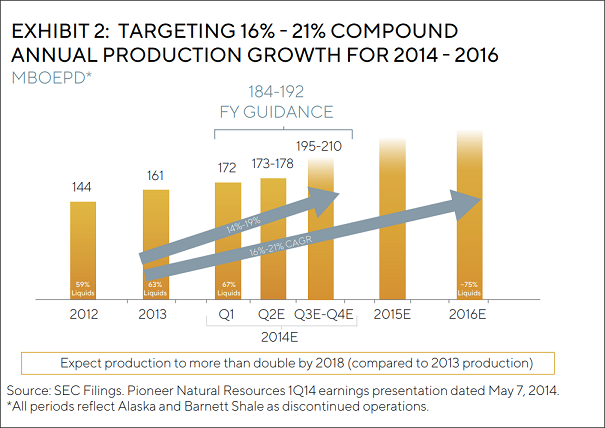
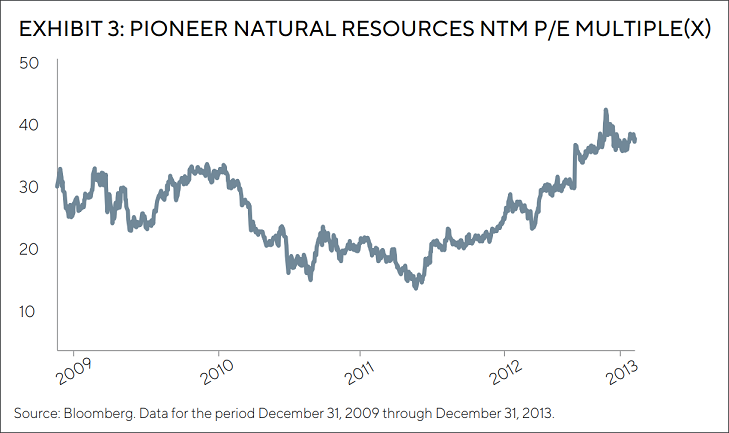
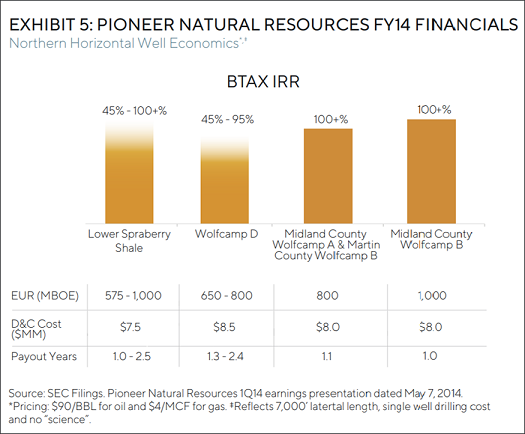
One major shale producer, Pioneer Natural Resources, targeted 16-21% annual production growth in 2014. As one broker noted back in 2015: “In a $75-80 oil world, PXD (Pioneer Natural Resources) can grow close to 20% for a decade and, hence, we view it as a large-cap must-own stock exiting this cycle, whenever you believe that is. We believe that clear bifurcation of US winners will attract capital and prevent PXD from getting ‘cheap’ on consensus metrics in a world where few assets are cheap.”1 As a result of this growth profile, the stock typically traded between 20x and 40x EPS during the shale boom. In our opinion, that sounds like the current pitch for software, as Gartner estimates >20% cloud software growth in 2023 despite overall IT spending only growing 5%.
As investor enthusiasm increased, companies created new metrics such as ‘lifetime value to customer acquisition costs’ (LTV to CAC) in the case of software and ‘oil well IRRs’ in the case of US shale. Both pointed to stellar unit economics and non-GAAP metrics to distract from the lack of cash flow and profitability at the company level. Investors bought into the narrative, believing that profitability would inevitably come once companies scaled up. To quote one respected bulge bracket analyst in 2015, “we believe as shale matures and industry growth profiles taper, at various rates, E&P (exploration & production) FCF will inflect, growth will slow, and shareholder returns will increase: the same path followed by many large caps before them".1
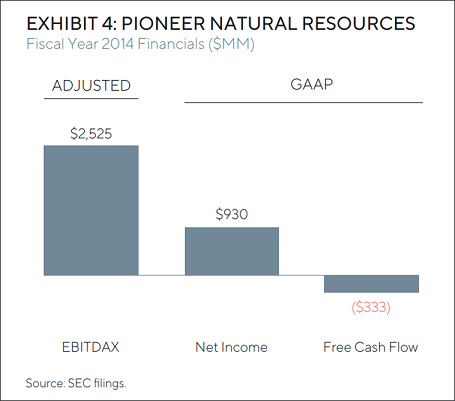
Those who followed the oil space back in the 2014 era probably recall optimistic projections of >100% ‘well IRRs’ and EBITDAX valuation metrics (which conveniently ignored depletion, depreciation and amortization, and exploration expenses). Ultimately, these forecasted returns were difficult to realize as management teams and analysts failed to account for the significant fixed costs in the business and the implications to consolidated margins. We believe a similar mistake is being made with software today – the myopic focus on LTV to CAC misses the fact that the median Russell 1000 business spends ~20% of revenue on research and development – excluding management overhead – weighing on consolidated margins.
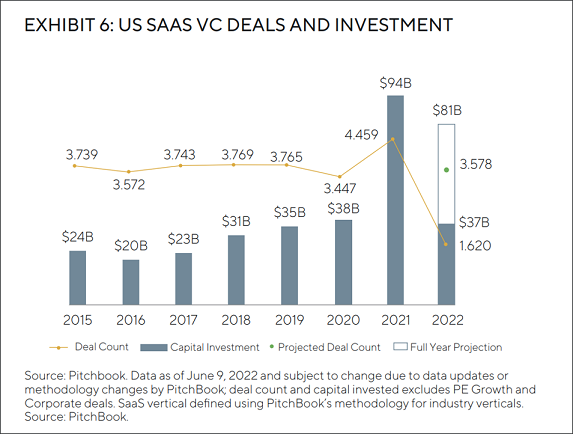
Ultimately, both industries turned to capital markets to fund losses. Hundreds of billions of dollars have entered both the US shale and software as a service (SaaS) industries over the last decade. For US shale, Deloitte estimates that from 2010 through 2020, industry free cash flow was negative $300 billion, relying on a combination of debt and equity to plug the cash flow gap. Similarly, in software, venture funding for US businesses has totalled greater than $300 billion since 2015. Even public companies have continued to rely on external financing: the Russell 1000 cohort issued ~$17 billion in share-based compensation over the last twelve months – which we view as the equivalent of equity financing, no different than if a company went to the equity markets and issued shares for cash. In other words, external capital entering the software industry has actually exceeded that of the then much-reviled shale industry.
Tech’s ESG issues: poor governance
Poor governance at many software companies presents meaningful ESG risks, even if software optically checks off the boxes in the ‘environmental’ and the ‘sustainable’ categories. Technology investors have largely overlooked governance issues in the past given the strong revenue growth profile of software companies in an era of weak overall economic growth. However, now that the industry has hit challenging times, poor governance practices are more in focus. Management teams seem to be running away from issues instead of facing them head-on. Examples of these poor practices include top-up compensation and sale processes.
Top-up compensation: Because talent had been so scarce on the software development side, companies would give out significant equity packages that vest over four years and usually at discounts to market prices. In the off-chance the share price ended up lower than expected, many employers would top-up and make up the difference with additional equity grants. It is a pretty good deal for the employee – unbounded upside and no downside. Equity shareholders, of course, are the losers in all of this because dilution ends up higher and GAAP margins end up lower. Zoom, one of many examples we can point to, has seen share-based compensation balloon to 27% of revenue in the most recent quarter versus 10% of revenue in 2020. GAAP operating margins peaked at 29% in the quarter ending January 2021 but have declined to 6% in the most recent quarter.
Sale processes: We have already seen many management teams throw in the towel and elect for take-privates. Previous darlings like Citrix and Avalara were recently purchased while a few others including Coupa have recently reached an agreement with a private equity company. Most of these take-private prices have been at meaningful discounts to all-time-highs, much to the detriment of public market investors. These take-privates have come after some deceleration in the fundamental businesses but represent poor governance, in our view.
We do not believe that boards nor management teams have been penalized for poor governance. On the contrary, many boards and management seem to be incentivized to execute on governance practices detrimental to shareholders. Unfortunately, we think governance violations will continue with impunity, another risk many investors have overlooked over the last decade, as many management teams and boards are not aligned with the interests of investors.
The differences
Technology investors would point to one major difference between software companies and oil companies: pricing power. Oil is a commodity, whereas software can theoretically raise prices on customers due to the high switching costs. However, the reality is that most software companies have not actually flexed their pricing power.
At Salesforce, for example, pricing has not been a material factor for revenue growth in the past few years. Instead, the company elects to engage in cross-selling or up- selling to grow spend within a customer. However, the ‘maintenance’ of said customer likely gets more expensive over time due to rising salaries, product development costs, and increased hardware, datacenter, and cloud costs. In short, the unit economics degrade over time, as evidenced by the decline in Salesforce’s gross margin from 80% in 2010 to ~73% in the most recent quarter. We believe the company’s margin profile and total revenue would look significantly different if they had flexed their theoretical pricing power.
Conclusion
It’s finally time for the rubber to meet the road, and unfortunately, we do not think most software companies are prepared. With that said, we will continue to monitor new data points and look for the exceptions, which may present interesting opportunities. But looking at the industry as a whole, it is hard to ignore the similarities – so for now the question remains: Why can’t software be the new shale?
1 Morgan Stanley – “Pioneer Natural Resources: Upgrading the Archetypal Shale Stock” – 7/13/15
Rajiv Jain, Chairman and Chief Investment Officer, alongside Brian Kersmanc and Sudarshan Murthy are at the helm of the Investment Management Team serving as Portfolio Managers for the GQG Partners portfolios. This article contains general information only, does not contain any personal advice and does not consider any prospective investor’s objectives, financial situation or needs.