Register For Our Mailing List

Register to receive our free weekly newsletter including editorials.

Home / 82

Superannuation and our growing wealth

Universal superannuation became an embedded component of the savings and wealth accumulation of workers some 21 years ago; a coming-of-age in 2014, so to speak. Only retired, non-working and some self-employed households missed out on the compulsory saving as part of employee’s remuneration, although voluntary contributions were to rise as well.

Of course, Life Offices had been offering retirement benefit packages for a long time in the form of industrial (weekly payments), ordinary (monthly payments) and superannuation type policies, of which only the last mentioned is of any significance today.

And government employee retirement benefits had also been around for many decades, usually unfunded, with retirement benefits paid out of current government receipts from taxes and Government Business Enterprises surpluses. That unfunded legacy is with us today, but addressed to some extent by the Howard/Costello Government while it was in office via the Future Fund.

The first chart shows the spectacular growth of superannuation assets, only temporarily reversing for two years during the onset of the GFC.

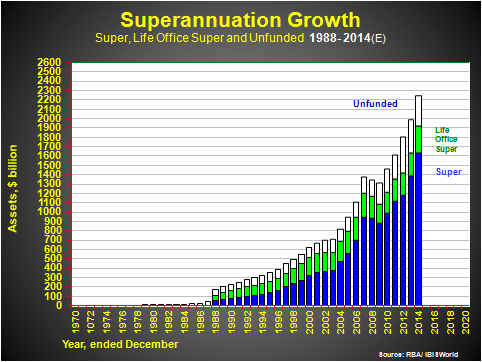
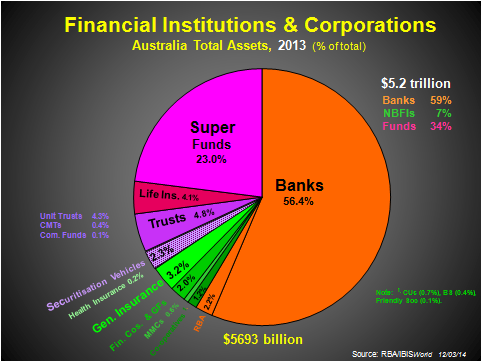
Assets will pass $2.2 trillion this year, from less than $100 billion 30 years ago. They will account for nearly 30% of the total assets of all financial institutions by the end of 2014, with banks diluted from an 80% lion’s-share of all assets up to 1940, to around 55% today. Still dominant. The second exhibit provides perspective in this regard.

At the end of 2013, approaching half the superannuation assets were in local shares (where they control nearly 60% of the ASX by capitalisation), 17% in overseas assets (including shares), 14% in bonds and other securities, 13% in cash and deposits, and the balance in property and other assets.

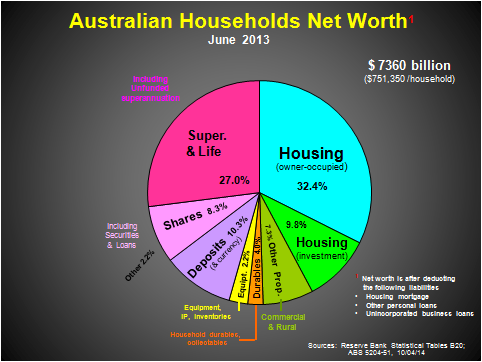
Clearly, superannuation has become an important part of household net worth as the third exhibit highlights.

At 27% of average household net worth of $751,000 in mid-2013, it is well ahead of investment property (16%) and is likely to overtake the value of owner-occupied housing (32%) soon.

Indeed, financial assets in total – including super, shares and deposits – are poised to overtake all hard assets (property, equipment and durables) within a few years. Some 25 years ago, financial assets represented 35% of net worth (including 11.4% in super). By the end of this year, the ratio will be over 50% with 24% in super.

This is a very positive development, as hard assets only yield a modest rental return plus capital gain, and never match the returns from active assets, notably shares.

So how much super does one need to have to be able to retire independent of the pension and with dignity? Twice as much as the average home, meaning that a home should no longer be regarded as the biggest investment of one’s life, as was the claim for much of the post-WWII years (although with a wide diversity of property values, every person’s position is unique).

Average household income for the 9 million+ households of the nation will be just over $150,000 by the end of 2014: yes, surprising as that figure is. It is suggested that retiring on a one-third share of average household income is a desirable goal. In turn, this would suggest a nest egg of around $830,000 taking out 6% each year and leaving enough to grow the capital in line with inflation.

Currently average super sits at around $100,000 per person or $240,000 per household in 2014, but this includes young people and households as well as retired ones. So a look at the differences across age groups is helpful in seeing how close we are to ‘dignified retirement’ at present, as the final exhibit shows.

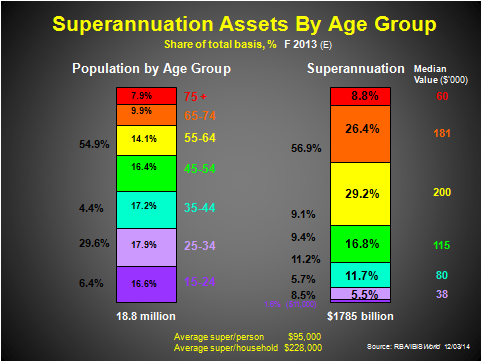
It suggests that recent retirees (aged 65-74) have a median value of super of $181,000 per person, or around $360,000 per household, or 40-45% of the ‘dignified retirement’ level. The even-older households are generally pensioners, with less than $75,000 per household in super (much of it via Life Offices).

Being averages, a minority of these age groups live comfortably, but most - perhaps over two-thirds - would be living a more abstemious lifestyle.

The younger Baby Boomers are currently the best-off in super, with over $400,000 per household and the capacity to improve on that level with a continuing working life for a decade or more. Their average could edge up towards 55-60% of the desirable level if they work long enough. Again, some retirees in this age bracket will easily reach a comfort zone. Generally, only a third or so of Baby Boomers (49-71 years) will retire with their wished-for comfort and dignity.

So, it is not all that salubrious, reminding us that we have a long way to go. It will take at least two generations (of an average of 20 years each) from 1993 to achieve the desired level of comfort for retirees. The Net Generation (12-32 years old) and the youngest of the Gen Xers (33-48 years old) are the first of the retirees likely to be comfortable. In theory, provided they have super and assuming no interim catastrophes and set-backs. But we are on the way, and leading the world.


Phil Ruthven AM is Chairman of IBISWorld.


4 Comments
Tim
October 09, 2014

Eliminating super tax would blow an additional $8 billion hole in the federal budget. Who pays for that in order for retirees to live in an effective tax haven for 20-30 years?

Kevin
October 05, 2014

Very interesting. Even more interesting that our Government continues to tax superannuation and deliberately restricts contributions given the obvious shortfall this article demonstrates. My interpretation is the Government is not concerned with us providing ourselves a comfortable retirement, merely to get us off the pension. As I’ve mentioned previously, this means ~$500K in super which if converted to an indexed lifetime annuity closely equates to the pension. Viewed from this perspective you can see why given the data in this article – specifically “The younger Baby Boomers are currently the best-off in super, with over $400,000 per household and the capacity to improve on that level with a continuing working life for a decade or more”, the Government has so heavily restricted the Baby Boomer’s super contributions compared to the previous very generous contribution limits.

Ben Hillier
October 06, 2014

Hmm, Kevin, I have to disagree somewhat. Are you suggesting super shouldn't be taxed at all, and that contributions should be uncapped? Who do you think this would assist? Certainly not the low-balance retirees mentioned in the article. These people are not putting any extra in super at the moment - they aren't getting close to the caps. Anyone who can contribute up to the caps over a period of time will be very well off indeed in retirement. Your ideas would just assist the wealthy to avoid tax in an unlimited manner. Super guarantee increases beyond 9.5% are the only real option to boost low super balances.

Paul Resnik
October 03, 2014

Great summary of Australian personal asset and income growth trends.


Leave a Comment:

RELATED ARTICLES

Super performance test will destroy viability of some funds

Three retirement checks for when you have enough

Retirement adequacy: COVID means we need to work longer

banner

Most viewed in recent weeks

Australian house prices close in on world record

Sydney is set to become the world’s most expensive city for housing over the next 12 months, a new report shows. Our other major cities aren’t far behind unless there are major changes to improve housing affordability.

The case for the $3 million super tax

The Government's proposed tax has copped a lot of flack though I think it's a reasonable approach to improve the long-term sustainability of superannuation and the retirement income system. Here’s why.

7 examples of how the new super tax will be calculated

You've no doubt heard about Division 296. These case studies show what people at various levels above the $3 million threshold might need to pay the ATO, with examples ranging from under $500 to more than $35,000.

The revolt against Baby Boomer wealth

The $3m super tax could be put down to the Government needing money and the wealthy being easy targets. It’s deeper than that though and this looks at the factors behind the policy and why more taxes on the wealthy are coming.

Meg on SMSFs: Withdrawing assets ahead of the $3m super tax

The super tax has caused an almighty scuffle, but for SMSFs impacted by the proposed tax, a big question remains: what should they do now? Here are ideas for those wanting to withdraw money from their SMSF.

The super tax and the defined benefits scandal

Australia's superannuation inequities date back to poor decisions made by Parliament two decades ago. If super for the wealthy needs resetting, so too does the defined benefits schemes for our public servants.

Latest Updates

Planning

Will young Australians be better off than their parents?

For much of Australia’s history, each new generation has been better off than the last: better jobs and incomes as well as improved living standards. A new report assesses whether this time may be different.

Superannuation

The rubbery numbers behind super tax concessions

In selling the super tax, Labor has repeated Treasury claims of there being $50 billion in super tax concessions annually, mostly flowing to high-income earners. This figure is vastly overstated.

Investment strategies

A steady road to getting rich

The latest lists of Australia’s wealthiest individuals show that while overall wealth has continued to rise, gains by individuals haven't been uniform. Many might have been better off adopting a simpler investment strategy.

Economy

Would a corporate tax cut boost productivity in Australia?

As inflation eases, the Albanese government is switching its focus to lifting Australia’s sluggish productivity. Can corporate tax cuts reboot growth - or are we chasing a theory that doesn’t quite work here?

Are V-shaped market recoveries becoming more frequent?

April’s sharp rebound may feel familiar, but are V-shaped recoveries really more common in the post-COVID world? A look at market history suggests otherwise and hints that a common bias might be skewing perceptions.

Investment strategies

Asset allocation in a world of riskier developed markets

Old distinctions between developed and emerging market bonds no longer hold true. At a time where true diversification matters more than ever, this has big ramifications for the way that portfolios should be constructed.

Investment strategies

Top 5 investment reads

As the July school holiday break nears, here are some investment classics to put onto your reading list. The books offer lessons in investment strategy, financial disasters, and mergers and acquisitions.

Sponsors

Alliances

© 2025 Morningstar, Inc. All rights reserved.

Disclaimer
The data, research and opinions provided here are for information purposes; are not an offer to buy or sell a security; and are not warranted to be correct, complete or accurate. Morningstar, its affiliates, and third-party content providers are not responsible for any investment decisions, damages or losses resulting from, or related to, the data and analyses or their use. To the extent any content is general advice, it has been prepared for clients of Morningstar Australasia Pty Ltd (ABN: 95 090 665 544, AFSL: 240892), without reference to your financial objectives, situation or needs. For more information refer to our Financial Services Guide. You should consider the advice in light of these matters and if applicable, the relevant Product Disclosure Statement before making any decision to invest. Past performance does not necessarily indicate a financial product’s future performance. To obtain advice tailored to your situation, contact a professional financial adviser. Articles are current as at date of publication.
This website contains information and opinions provided by third parties. Inclusion of this information does not necessarily represent Morningstar’s positions, strategies or opinions and should not be considered an endorsement by Morningstar.