A review of nabtrade’s annual trading data shows some key trends among retail investors. New accounts – which includes those new to the sharemarket in addition to those switching trading accounts – increased by 13%, while total domestic turnover grew by 2%. All generations were net sellers of domestic equities, as cash holdings reached record highs. On the other hand, international turnover grew by 30% and all investor groups were net buyers throughout the year.
Growth driven by younger investors
While Baby Boomers continue to hold the greatest share of wealth among nabtrade investors, it was the Gen Z (those born after 1995) and Gen Y investors (those born between 1980 and 1995) who recorded the biggest gains, up 73% and 20% respectively in the 12 months to 31 December 2018.
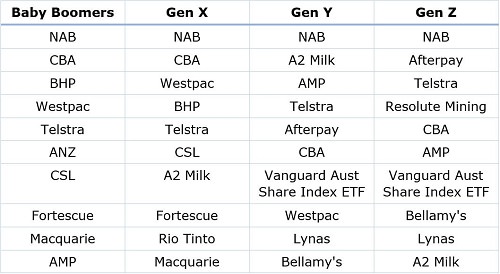
Younger investors remain interested in the blue-chip shares favoured by older generations, such as financials, but also pursued growth stocks such as Afterpay and A2 Milk.
A feature of the top 10 domestic buys among younger investors was the presence of diversified solutions such as ASX200 ETFs. As many younger investors are new to the market and are slowly building their expertise and confidence in investing, diversified products give them broad exposure while minimising stock-specific risk.
Interestingly, younger investors showed similar contrarian tendencies as their older peers when investing in AMP during a tough year for the stock.
These trends reflect easier access to share investing for young investors than would have been available to their parents and grandparents, whose early forays into equity markets would likely have included finding a stockbroker in the White Pages and checking daily prices in the newspaper. Investors can now open an account online in minutes, free of charge, access high quality research and insights, set up watchlists and invest small sums for brokerage that costs about the same as a smashed avocado breakfast.
Sector rotations for older investors
For those investors with established portfolios, there was a shift away from financials, consumer discretionary and telecommunications stocks, and an increase in holdings in healthcare and consumer staples.
This reflects a shift toward more defensive sectors in the face of economic and sector specific headwinds, but also concerns about the overweight sector positions many investors have held over the last five years.
While financials dominated the top 10 buys as they have in previous years, they also dominated the sells as investors reduced their overall exposure. Gen Y was the only group to buck this trend, increasing exposure to financials slightly.
Continuing demand for international equities
nabtrade offers investors the opportunity to invest directly in the US, United Kingdom, Germany and Hong Kong. Appetite for stocks on these markets grew by 30% in 2018, driven by an increase of 38% among Gen Z investors, 32% for Gen X and 31% for Gen Y. Over 90% of these trades were in the US, although demand for Asian, particularly Chinese, stocks continues to increase (these may be listed in the US or Hong Kong). The total number of new customers investing in international shares rose 32%.
Australian investors, particularly younger investors, appear to appreciate that while the Australian sharemarket offers some great opportunities, many critical, fast-growing sectors are not well represented on the local exchanges.
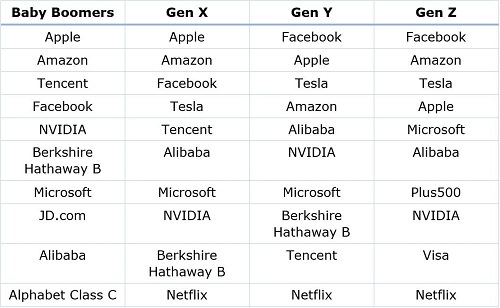
These investors are generally pursuing two key themes – technology and the rise of the Asian consumer. They are often choosing to create exposure directly into the US or Asian markets. For young investors who are checking their Facebook, Instagram or trading accounts on an Apple or Samsung phone, this desire to invest in the products and services they access on a daily basis is entirely logical. The emergence of the Asian tech giants in the top 10 reflects a shift away from the FAANG dominance of recent years and a more global approach to investing offshore.
As with previous years, the only non-technology-based stock to appear consistently in the top 10 International buys is Berkshire Hathaway, Warren Buffett’s investment company. These are primarily Class B shares, which are currently priced around US$200, rather than the better-known Class A shares, which are valued at over US$300,000.
Top 10 domestic BUYs by value during 12 months to 31/12/18
Top 10 international BUYs by value during 12 months to 31/12/18
What about international ETFs
Data on Exchange Traded Funds in 2018 shows international equities attracted the largest flows, so why are none of them in the Top 10 in the nabtrade data?
It might be explained by the specific characteristics of nabtrade investors. They can access global stock exchanges directly in the US, UK, Germany and Hong Kong. We also offer the ASX's mFund range so there is a dilution of investments in any single product or strategy. Global flows are spread between S&P500, followed by NASDAQ, followed by a MSCI-type investments outside the US. Plus many investors are keen to ride the Asian consumer and Asian tech stories, such as Tencent, Alibaba and Baidu. Investors appear to prefer to go direct for specific themes rather than into the indexes represented by the ETF flows. Most nabtrade clients are self-directed, whereas financial advisers are greater users of funds.
Gemma Dale is Director of SMSF and Investor Behaviour at nabtrade, a sponsor of Cuffelinks. Any information in this publication is of a general nature only. It is not intended to be a substitute for specialised advice and nabtrade is not a registered tax agent.
Nabtrade is a sponsor of Cuffelinks. For more articles and papers from nabtrade, please click here.