Register For Our Mailing List

Register to receive our free weekly newsletter including editorials.

Home / 345

Where do sustainable returns come from?

Share prices across the Australian market have risen by an average of 20% over the past 12 months. This looks like great news on the surface but we need to look deeper to see where those gains came from and whether they are sustainable.

People have a tendency to mentally ‘lock in’ past gains and assume they are ‘in the bank’. The problem is that almost all of the 20% share price gains over the past 12 months were probably only temporary and should not be assumed to be ‘locked in’ at all. The 20% share price gains were not underpinned by 20% higher company profits nor 20% higher dividends. Profits per share across the market actually fell over the period, and dividends per share rose by only 4% (and most of the dividend increases were due to temporary commodity price spikes from the miners).

Paying more for the same profits

Twelve months ago, investors were prepared to pay $16.25 per dollar of company profits, but over the past year, they bid the price up to $20.40 per dollar of profits. They are now paying 25% more per dollar of profit than they did a year ago.

Twelve months ago, investors were prepared to pay $23 per dollar of company dividends (i.e. dividend yield of 4.34%) but over the past year they bid the price up to $26.40 per dollar of dividends (dividend yield of 3.8%). They are now paying 14% more per dollar of dividends than a year ago.

What caused this miraculous 25% increase in the price paid for a dollar of profits and 14% increase in the price of a dollar of dividends?

The main reason is confidence levels. At the start of 2019 people were pessimistic and feared the late 2018 ‘global growth scare’ might turn into the next GFC or possibly worse, especially as the US Fed was still raising interest rates amid Trump’s trade wars. Investor pessimism quickly turned to confidence when the Fed switched from rate hikes in 2018 to rate cuts in 2019. Central banks raise rates when they are bullish on the economy and cut rates when they are bearish. The crowd (investors) do the reverse.

The charts break this down by market sector. The left chart shows price gains over the past 12 months; the middle chart splits this into changes in earnings (profits) per share and changes in the price paid per dollar of profits; and the right chart does the same for dividends:

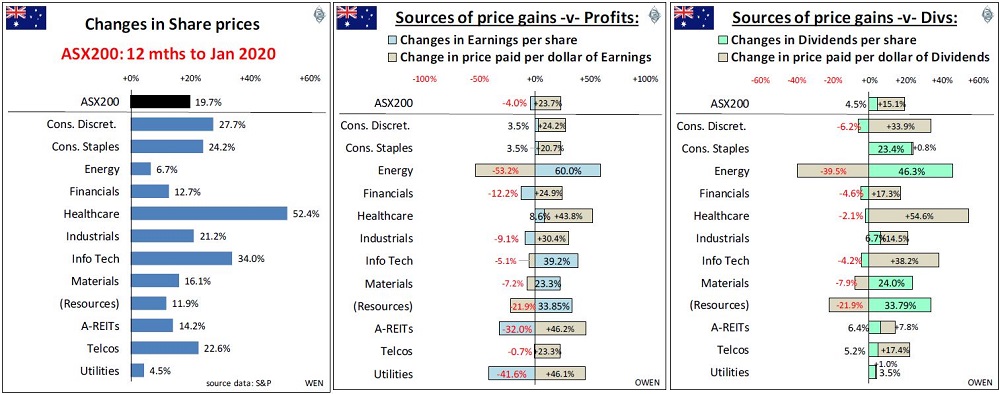
Looking at the two big sectors:

First: Financials. Profits per share fell (across the Big 4 banks plus other disasters like AMP) but share prices rose 13%, so investors en masse boosted the price per dollar of profit by 25%, and the price per dollar of dividend by 17% (dividends also fell). The crowd assumes the current banking woes are temporary and banks will miraculously return to the golden years of double-digit profit growth. Our view has been that those golden years are gone. The banks are facing not only cyclical pressures (margin pressure from ultra-low rates, and bad debts from property developers/investors) but also more lasting structural pressures (crippling regulations, expensive remediation and compliance, higher capital costs, deteriorating demographics).

Second: Resources. Profits and dividends rose by 30%+ per share, a combination of recoveries from big write-offs from prior years, plus the fortuitous spikes in iron ore and oil prices. Investors have sensibly discounted this and only bid up share prices by 12% because they know this profit and dividend growth is not repeatable. Many of the miners are probably underpriced at current levels.

The market is now in expensive territory, with price/earnings ratios above 20 (more than $20 being paid per dollar of profits) and dividend yields below 3.8% ($26.40 per dollar of dividends). In order to hold on to the recent price gains, either profits and dividends need to rise substantially in 2020, or central banks need to keep cutting rates and buying up assets. That is, central banks need to remain bearish and pessimistic so that the crowd remains overconfident. 


Ashley Owen is Chief Investment Officer at advisory firm Stanford Brown and The Lunar Group. He is also a Director of Third Link Investment Managers, a fund that supports Australian charities. This article is for general information purposes only and does not consider the circumstances of any individual.


  •   19 February 2020
  • 6
  •      
  •   
6 Comments
Tony Reardon
February 19, 2020

We review our asset allocations every half year. The 2019 performance of local and international equities of 20%+ naturally led to a slightly out of balance portfolio and so we we moved a percentage out of equities into fixed interest. While this might feel like one is “selling winners”, it does lock in some of those profits.

stefy
February 19, 2020

I believe the current share market prices and global warming are intimately related. Let me explain why. The current market prices are based wholly and solely on fiat money creation by the Fed in USA ($500 billion late last year alone). The exponential rise in fiat money has facilitated the rise of an economic backwater in China to a superpower producing every consumer good possible. It has made the world full of possibilities, exploit commodities worldwide, create new mines and industries, increase production etc etc, and allow wild asset inflation like housing and stocks. Fiat money, a world without limits, has created global climate change as sure as I am alive and breathing. So much for modern money theory.

Mark
February 19, 2020

Good afternoon,

Thanks for this good article. Could you please provide some explanation of how dividend yields below 3.8% equate to $26.40 per dollar of dividends.

a owen
February 20, 2020

hi mark - if I pay $100 for a share that pays $3.80 dividend I am paying 100/3.8 = $26.40 dollars per dollar of dividend (I rounded the 3.8% div yield for the story). It is the reverse of the price/earnings ratio because the numerator and denominator are switched. If I pay $26.40 for a dollar of dividends I am hoping of course that dividends rise over time - but that is always the case whether I pay $20 or $30 or even $10.
cheers

ashley

Warren Bird
February 20, 2020

Ashley, your calculation is not the reverse of a P/E. It's still got P on the top, but you have D instead of E on the bottom.

And you don't actually need dividends to grow to justify paying $100 for $3.80 a year of income. It just means that you're discounting $3.80 a year at 3.8%.
But I understand that what you're saying is you'd rather have dividends grow so that your total return is better than 3.8% a year.

Mark
February 20, 2020

Thanks Ashley, appreciate your help.

Cheers

Mark


Leave a Comment:

RELATED ARTICLES

Australian large caps outperform small caps over long term

Are franking credits worth pursuing?

Buy the dips?

banner

Most viewed in recent weeks

How cutting the CGT discount could help rebalance housing market

A more rational taxation system that supports home ownership but discourages asset speculation could provide greater financial support to first home buyers.

3 ways to fix Australia’s affordability crisis

Our cost-of-living pressures go beyond the RBA: surging house prices, excessive migration, and expanding government programs, including the NDIS, are fuelling inflation, demanding bold, structural solutions.

Making sense of record high markets as the world catches fire

The post-World War Two economic system is unravelling, leading to huge shifts in currency, bond and commodity markets, yet stocks seem oblivious to the chaos. This looks to history as a guide for what’s next.

Is there a better way to reform the CGT discount?

The capital gains tax discount is under review, but debate should go beyond its size. Its original purpose, design flaws and distortions suggest Australia could adopt a better, more targeted approach.

Welcome to Firstlinks Edition 648 with weekend update

This is my last edition as Editor of Firstlinks. I’m moving onto a new role though the newsletter will remain in good hands until my permanent replacement is found.

  • 5 February 2026

It’s economic reality, not fear-based momentum, driving gold higher

Most commentary on gold's recent record highs focus on it being the product of fear or speculative momentum. That's ignoring the deeper structural drivers at play. 

Latest Updates

Superannuation

Super is catching up, but ageing is a triple-threat

An ageing Australia is shifting the superannuation system’s focus from accumulation to the lifecycle of retirement. While these pressures have been anticipated for decades, they are now converging at scale and driving widespread industry change.

Investment strategies

Corporate earnings show resilience against volatility but risks remain

Evidence for a strong reporting season had been piling up for months and validated an upgrade cycle already underway. However, risks remain from policy uncertainty.

Superannuation

Want your loved ones to inherit your super? You can’t afford to skip this one step

One in five Australians die before retirement and most have not set up their super properly so their loved ones can benefit from all their hard work and savings. 

SMSF strategies

Sixteen steps in a typical SMSF borrowing

Getting a mortgage is never an easy process but when an investment property is purchased in a SMSF the complexity increases significantly. Read this before taking the plunge. 

Planning

Do HNWI get better advice?

Good advisers lead to more diversification, lower turnover and less home bias. However, studies show the average adviser may not be adding much value to clients. 

Strategy

AFL Final Ten with wildcard edit 'unlevels' the field

When the new AFL season kicks off a wild-card will be added to the finals. Is this new formula fair and how does it impact the odds of winning the premiership.

Planning

Love them or hate them, it's worth understanding annuities

Investors have historically balked at exchanging a lump sum for a future steam of income. Breaking down the financial and emotional considerations of purchasing an annuity.        

Sponsors

Alliances

© 2026 Morningstar, Inc. All rights reserved.

Disclaimer
The data, research and opinions provided here are for information purposes; are not an offer to buy or sell a security; and are not warranted to be correct, complete or accurate. Morningstar, its affiliates, and third-party content providers are not responsible for any investment decisions, damages or losses resulting from, or related to, the data and analyses or their use. To the extent any content is general advice, it has been prepared for clients of Morningstar Australasia Pty Ltd (ABN: 95 090 665 544, AFSL: 240892), without reference to your financial objectives, situation or needs. For more information refer to our Financial Services Guide. You should consider the advice in light of these matters and if applicable, the relevant Product Disclosure Statement before making any decision to invest. Past performance does not necessarily indicate a financial product’s future performance. To obtain advice tailored to your situation, contact a professional financial adviser. Articles are current as at date of publication.
This website contains information and opinions provided by third parties. Inclusion of this information does not necessarily represent Morningstar’s positions, strategies or opinions and should not be considered an endorsement by Morningstar.