After more than a decade of outperformance, US stocks have come to dominate many equity portfolios, as enthusiasm for artificial intelligence propelled Magnificent 7 tech stocks higher and U.S. growth outpaced peers.
But outside the spotlight, a select group of non-US equities has quietly - but decidedly - made a case for itself. Each year for the past decade, an average of 82 of the top-100 performing stocks in the MSCI All Country World Index were headquartered outside the US, their gains driven by strong business models and secular tailwinds that mattered more than their physical address.1 For investors wary of allocating away from the US, these stocks suggest a selective approach to non-US markets could pay off, especially given gaps in valuation between US and non-US peers and an equity cycle that is showing signs it could be due for a change.
Pockets of comparable performance
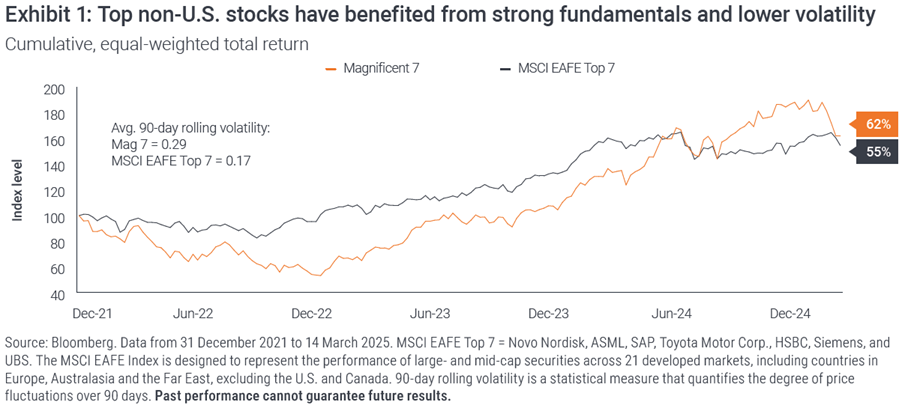
The Mag 7's outperformance in the S&P 500 Index is widely recognised. Less known is that, in some cases, top contributors in non-US indices have also achieved robust gains. In fact, while the Mag 7 returned a cumulative 62% since early 2022 on an equal-weighted basis, the top seven contributors in the MSCI EAFE Index delivered 55%, benefiting in part from less volatility, such as during the broad market pullback in 2022, and lower valuations.
Diversified sources of return
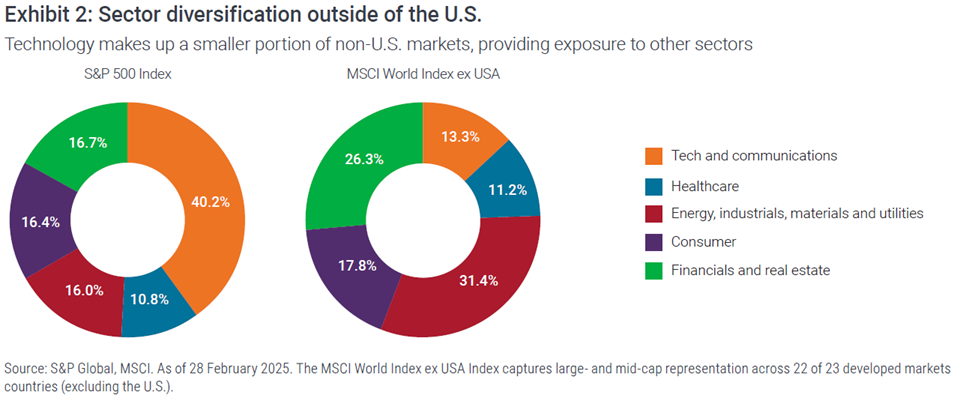
Notably, the leading stocks in the MSCI EAFE were not all tech names. Rather, the group consisted of healthcare, industrials, and financials (as well as tech). This lack of sector concentration provided investors with portfolio diversification and reflected growth drivers besides Al, including rising defense spending, rapid medical innovation, and the end of zero-rate monetary policies.
A valuation advantage
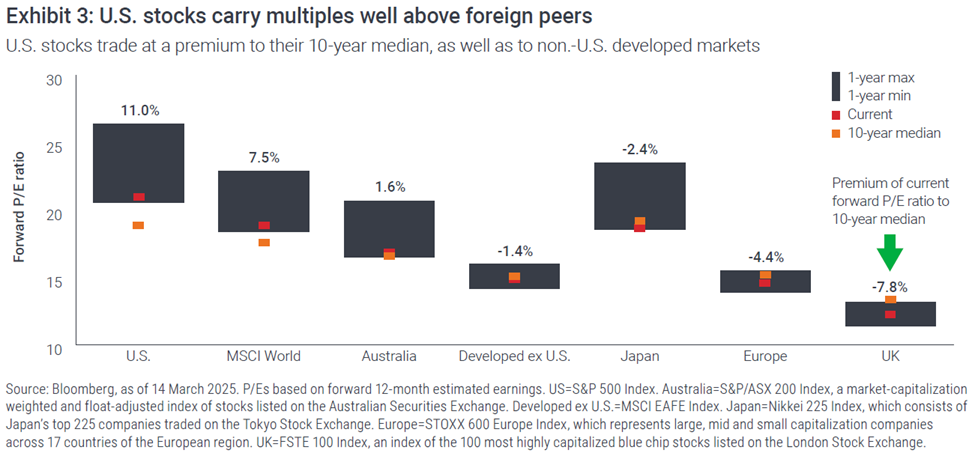
Even with recent gains, many top-performing non-US stocks trade at a discount to US peers. Some valuation gap may be warranted given faster economic growth in the U.S. and the potential earnings and productivity advantages of Al. But the premium/discount appears to reflect a market that prioritises geography over fundamentals, even those that are positive. In the MSCI Europe Index, for example, roughly three-quarters of sales are now generated outside the Eurozone, similar to the S&P 500 Technology sector, which does nearly 60% of revenues in non-US markets.2
Attractive shareholder yield
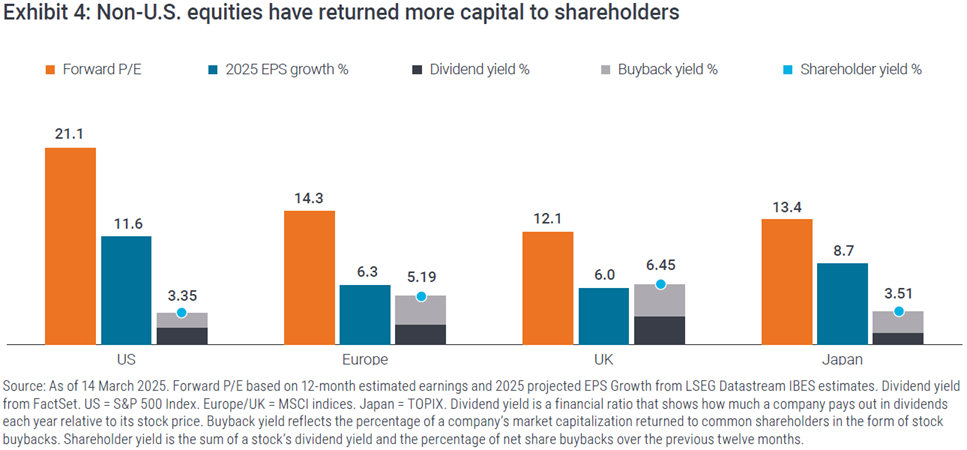
This geographic handicap leaves room for upside, in our view, among high-performing non-US companies. There's also opportunity for capital payouts, with shareholder yield - a measure of dividends and buybacks - typically more generous outside the US. Even in Japan, where corporate governance standards have lagged for years, new reforms are pressuring public firms to unlock more value for investors. In 2024, share buybacks in Japan hit a record high of more than ¥18 trillion (US$121 billion), up from less than ¥10 trillion in 2023. For 2025, the sum is expected to top ¥20 trillion.3
A history of mean reversion
To be sure, non-US markets have faced challenges. In 2024, Germany, the engine of the Eurozone economy, had its second straight year of recession, while cumbersome regulations have raised costs and stifled demand across Europe. Meanwhile, Japan only recently emerged from a prolonged period of deflation and still has a ways to go with corporate reforms. (Nearly half of companies in the Tokyo Stock Price Index still trade below book value compared to less than 4% of US companies.)4
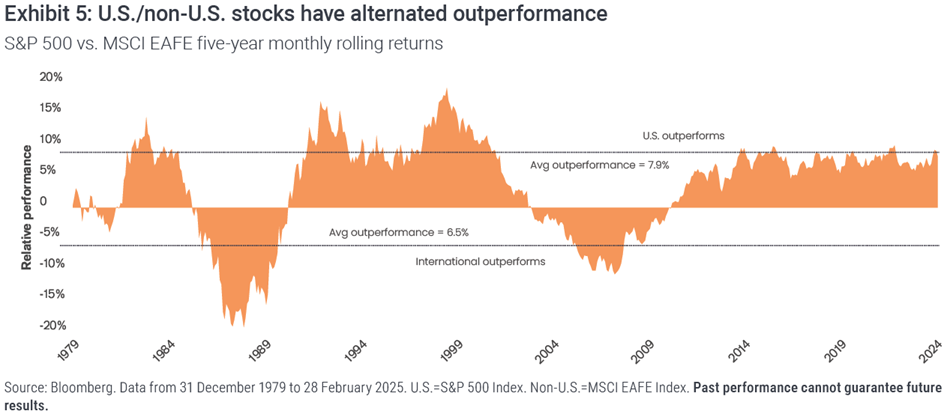
But history shows global equity returns tend to be cyclical and that outperformance can flip, often after periods of stretched valuations. Since 1980, US and non-US stocks have consistently taken turns leading markets, with the most enduring US-led periods lasting an average of more than eight years. Should markets keep up the pattern, non-US equities could soon have their comeuppance: US stocks' current run on top has lasted roughly 14 years.
Not timing the cycle
While it is impossible to pinpoint if or when a rotation might occur, an active approach to non-US stocks could still pay dividends in a diversified portfolio. Over the past decade, 65% of actively managed international funds have outperformed their respective benchmarks on an annualised basis.5 Meanwhile, structural changes that have started to take hold - from a faster pace of rate cuts and pledges to increase defense spending in Europe to market reforms in Japan - create the potential for differentiated returns (see Case example).
Avoiding recency bias
In the end, staying focused on fundamentals could also help investors avoid recency bias, or the tendency to extrapolate recent data points into perpetuity. In fact, historically, allowing recency bias to determine investment decisions would have meant overweighting international stocks in 1990, US stocks in 2000, and international stocks in 2008 - all times when the opposite would have been the better choice.
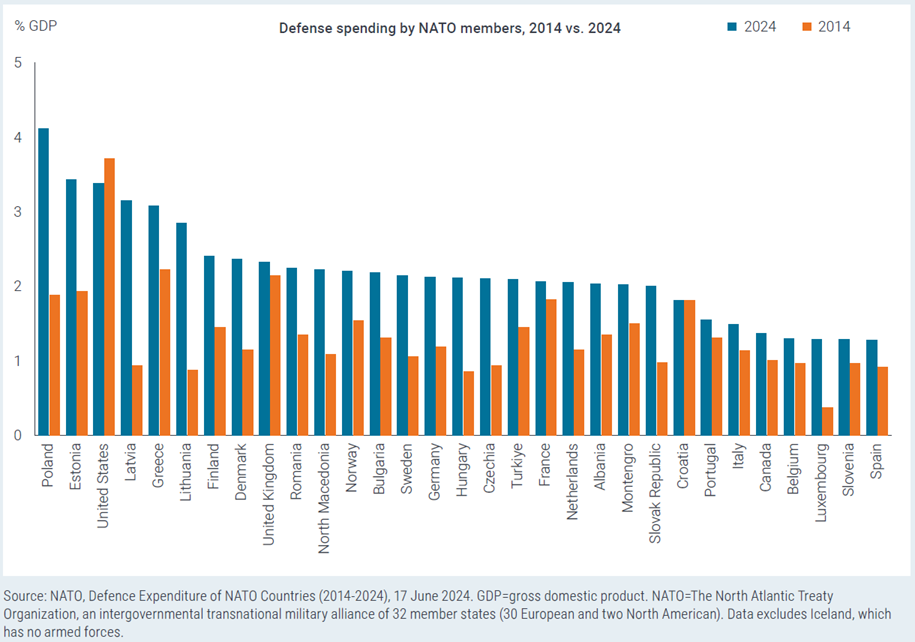
Case example: European defence
Following the Cold War, defence budgets in Europe experienced little to no growth. But amid new geopolitical tensions and a change in White House leadership, defence spending in the region looks set to accelerate.
Already, countries located near Russia have been dramatically increasing defence expenditures as a percentage of their gross domestic product (GDP). Poland, for example, committed more than 4% of its GDP in 2024, up from less than 2% a decade ago. More recently, Ursula von der Leyen, president of the European Commission, said the EU plans to activate a mechanism that allows member states to substantially increase defence expenditures without having to make cuts elsewhere. She also proposed lending up to 150 billion euros (US$158 billion) to EU governments to rearm amid worries about faltering US support for Ukraine. Some countries have already taken action. Germany's incoming government, for example, recently voted to launch a 500 billion euro ($540 billion) fund to invest in infrastructure projects and amend the constitution to exclude defence outlays from fiscal spending limits.
The shift in policy has helped to lift non-US defence stocks, but with shares having traded at discounted valuations for several years, markets may now only be starting to catch up to the potential for faster growth.
1 Morningstar, as of 31 December 2024.
2 FactSet, as of 31 December 2024. The S&P 500 Technology Sector comprises those companies included in the S&P 500 that are classified as members of the GICS® information technology sector.
3 Ichiyoshi Securities, The Japan Times, as of 31 December 2024. “Listed Japanese firms’ share buybacks hit record in 2024”.
4 Bloomberg, as of 28 February 2024.
5 Morningstar. Data are for 10-year annualised returns for active foreign large-blend funds versus their benchmarks from 1 January 2015 to 31 December 2024.
Lucas Klein is Head of EMEA and Asia Pacific Equities at Janus Henderson Investors. Nothing in this article should be construed as advice. Past performance does not predict future returns. References made to individual securities do not constitute a recommendation to buy, sell or hold any security, investment strategy or market sector, and should not be assumed to be profitable. Janus Henderson Investors, its affiliated advisor, or its employees, may have a position in the securities mentioned.