Register For Our Mailing List

Register to receive our free weekly newsletter including editorials.

Home / 261

Winners and losers in sharemarkets, 2017/18

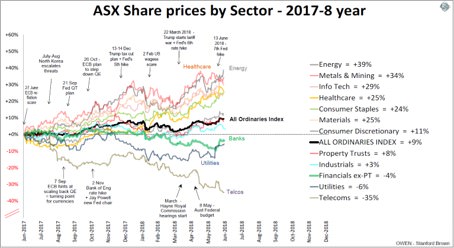
The broad Australian share market posted total returns (including dividends) of 14% for the 2017-2018 year. This was the sixth straight financial year of positive total returns (although the 2015-2016 year was line ball following the commodities price collapse). Here is a chart of the main sector price indexes over past 12 months.

Click to enlarge

Winners and losers by sector

The sectors that dragged down returns were the banks, telecommunications and utilities. They account for nearly half of the total market value. The main culprits were the banks (‘Financials ex-property trust’ sector above). All of the big dinosaur banks were down heavily with CBA the worst, down 12%. Macquarie, which is more of an asset manager than a bank, is the only local ‘bank’ with any global or even regional potential and was up a strong 40%. AMP was down another 30% for the year and is now more than 80% below its listing price 19 years ago.

Telstra fell another 39% over the year as it cut dividends and faces more cuts in coming years. Its share price is now 70% below its dot-com peak 19 years ago. Both AMP and Telstra were sleepy old institutions prior to their stock market listings but both were crippled by disastrous spending sprees undertaken by their imported American CEOs in their early years as listed companies. They have both been plagued by poor management distracted by cleaning up the messes of the past. Unfortunately, hundreds of thousands of retail investors were caught up in the hype drummed up for their listings in the late 1990s boom and many are still clinging grimly to their shares today.

Most other sectors of the market had a great year. Resources were the best, benefiting from rising commodities prices and finally a weaker Australian dollar. Miners were up strongly virtually across the board, led by BHP and RIO (up 45% and 32% respectively). Fortescue was the only major exception. In the Energy sector, all of the major oil, gas and coal stocks were up strongly on higher oil prices.

The Tech sector also rode the global tech boom. Computershare was up 30%, Carsales and REA both up 30+%. Healthcare stocks were aided by global healthcare strength, with CSL, Cochlear, Fisher & Paykel Health and especially Sirtex up strongly.

Although the overall Australian share market is not overpriced on a variety of valuation measures, our outlook for returns is rather subdued. The banks are facing a housing and construction slowdown, rising compliance costs, and management severely distracted by the fallout from the Financial Services Royal Commission. Falling housing prices, credit restrictions and rising mortgage interest rates risk hurting local demand for products and services, while exporters face lower global demand if the trade war escalates

Impact of a falling Aussie dollar on global equities

One of the big impacts on investment portfolios this year has been the Australian dollar, and how much of the currency risk in international share holdings was ‘hedged’ or ‘unhedged’.

Some global share funds have the currency risk ‘hedged’ (like the Exchange Traded Fund ‘VGAD’ and the Magellan Infrastructure Fund) while others leave the currency risk ‘unhedged’ (like the ETF ‘VGS’ and the MFS Global Fund). The decision on how much hedging to use can make a big difference to portfolio returns.

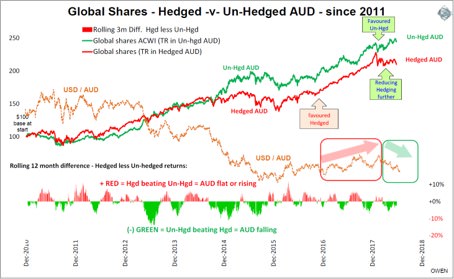
In the chart below, the red line shows returns in Australian dollars from global shares when the currency risk is hedged, and the green line shows returns when the currency is unhedged.

Hedged returns do better when the Aussie dollar is rising or flat (usually in booms), and unhedged returns do better when the Aussie dollar is falling (usually in busts). The lower section shows the relative returns between hedged and unhedged - positive red bars when hedged returns are beating unhedged (AUD rising or flat) and negative green bars when unhedged is winning (AUD falling). The orange dotted line running through the middle of the chart shows the US Dollar / Aussie dollar exchange rate.

Click to enlarge

This calendar year, the US dollar has risen and Aussie dollar has fallen. Hedged returns (red) have been flat as global shares have stalled, but unhedged returns (green) have continued to rise. It shows how performance of global shares for unhedged Australian investors can be affected as much by the currency as the underlying funds, companies or markets.


Ashley Owen is Chief Investment Officer at advisory firm Stanford Brown and The Lunar Group. He is also a Director of Third Link Investment Managers, a fund that supports Australian charities. This article is general information that does not consider the circumstances of any individual.


Leave a Comment:

RELATED ARTICLES

Why August company reporting season was poor

ASX large cap outlook for 2025

It was a good year for shares, but what’s ahead?

banner

Most viewed in recent weeks

Raising the GST to 15%

Treasurer Jim Chalmers aims to tackle tax reform but faces challenges. Previous reviews struggled due to political sensitivities, highlighting the need for comprehensive and politically feasible change.

7 examples of how the new super tax will be calculated

You've no doubt heard about Division 296. These case studies show what people at various levels above the $3 million threshold might need to pay the ATO, with examples ranging from under $500 to more than $35,000.

Are franking credits hurting Australia’s economy?

Business investment and per capita GDP have languished over the past decade and the Labor Government is conducting inquiries to find out why. Franking credits should be part of the debate about our stalling economy.

Here's what should replace the $3 million super tax

With Div. 296 looming, is there a smarter way to tax superannuation? This proposes a fairer, income-linked alternative that respects compounding, ensures predictability, and avoids taxing unrealised capital gains. 

The rubbery numbers behind super tax concessions

In selling the super tax, Labor has repeated Treasury claims of there being $50 billion in super tax concessions annually, mostly flowing to high-income earners. This figure is vastly overstated.

9 winning investment strategies

There are many ways to invest in stocks, but some strategies are more effective than others. Here are nine tried and tested investment approaches - choosing one of these can improve your chances of reaching your financial goals.

Latest Updates

Taxation

100 Aussies: seven charts on who earns, pays, and owns

The Labor government is talking up tax reform to lift Australia’s ailing economic growth. Before any changes are made, it’s important to know who pays tax, who owns assets, and how much people have in their super for retirement.

7 key charts on the state of the Australian property market

The Australian property market stirs fierce debate - often bullish optimism versus crash predictions. But beyond the noise, seven charts reveal what's really driving prices and the outlook for residential real estate.

A simple alternative to the $3 million super tax

Division 296 aims to introduce improved fairness into the superannuation system, yet is overly complex. This scours the world for better ideas and suggests a simpler alternative which can achieve the same goals.

CBA and the index conundrum for super funds

After the hyperbolic rise in CBA shares, super funds are floating the idea of carving out the weightings of ASX bank securities and indexing them within their portfolios. This looks at why that might be a big error.

Strategy

10 policies to drive Australian productivity higher

Here's a comprehensive list of proposed reforms to fix Australia's stagnating economy, including introducing a flat income tax rate, reducing migration, and making childcare tax-deductible.

Interviews

Where to find big winners in Asia

As more money looks for a home outside the US, Asia may soon get some love. Fidelity's Anthony Srom outlines the best places in Asia to invest, including in Chinese consumer names, Indian financials, and Thailand.

Investment strategies

We have trouble understanding the time value of money

We overvalue the present and underestimate the future - it’s a cognitive glitch called hyperbolic discounting. It affects savings, spending, and loans, and it's more common - and costly - than we think. 

Sponsors

Alliances

© 2025 Morningstar, Inc. All rights reserved.

Disclaimer
The data, research and opinions provided here are for information purposes; are not an offer to buy or sell a security; and are not warranted to be correct, complete or accurate. Morningstar, its affiliates, and third-party content providers are not responsible for any investment decisions, damages or losses resulting from, or related to, the data and analyses or their use. To the extent any content is general advice, it has been prepared for clients of Morningstar Australasia Pty Ltd (ABN: 95 090 665 544, AFSL: 240892), without reference to your financial objectives, situation or needs. For more information refer to our Financial Services Guide. You should consider the advice in light of these matters and if applicable, the relevant Product Disclosure Statement before making any decision to invest. Past performance does not necessarily indicate a financial product’s future performance. To obtain advice tailored to your situation, contact a professional financial adviser. Articles are current as at date of publication.
This website contains information and opinions provided by third parties. Inclusion of this information does not necessarily represent Morningstar’s positions, strategies or opinions and should not be considered an endorsement by Morningstar.