The global economy is entering a new era of protectionism, with President Trump’s second-term tariffs sparking renewed volatility in global trade. The US has announced a 25% tariff on imports from both Canada and Mexico (with some exemptions) and doubled the existing tariffs on all Chinese imports to 20%. Further, America enacted a sweeping 25% duty on steel and aluminium this week.
As expected, these moves triggered retaliatory responses from the targeted countries, with China imposing 10-15% tariffs on US agricultural products, Canada taking aim with 25% tariffs across more than US$100 billion worth of US imports and Mexico also threatening countermeasures.
However, uncertainty reigns in this tit-for-tat trade war as negotiations continue and the details about tariffs remain in flux.
A tale of tariffs
Throughout history, tariffs have been a wildcard for equities, driving market volatility and reshaping investment dynamics. While the outcome of the current trade war remains unknown, we can look to the past for insights. Below we explore three historical scenarios, each set in different growth environments, to see how equities have responded to trade tensions. We also examine the performance ‘quality’ companies – those with high return on equity, earnings stability and low financial leverage.
US-China trade war (2018–2019)
In the most recent tariff war, the Trump administration imposed 10-25% tariffs on US$250 billion worth of Chinese goods in the technology, machinery, and industrial sectors. In response, China retaliated with US$110 billion worth of tariffs on agriculture, automobiles, and energy goods from the US. A trade deal, known as the ‘Phase One Deal’, was entered in early 2020, leading to tariff reductions, but the broader impact of the trade tensions took some time to unwind.
Impact on equities in a resilient growth environment: The US was cushioned by a strong growth backdrop, with US Real GDP growing by 2.5% and 3% in 2018 and 2019. Developed markets were also in good shape, and while international equities sold off at the start, they ultimately rebounded with positive gains at the end of the period. China’s economy, meanwhile, experienced a noticeable slowdown over this period, and equities declined nearly 30% peak-to-trough. The market started to recover mid-way through the trade war but ended the period with a moderate loss. Notably, quality companies in developed markets demonstrated greater resilience compared to the benchmark, showing a smaller drawdown and faster recovery.
Chart 1: Global equities during US-China trade war
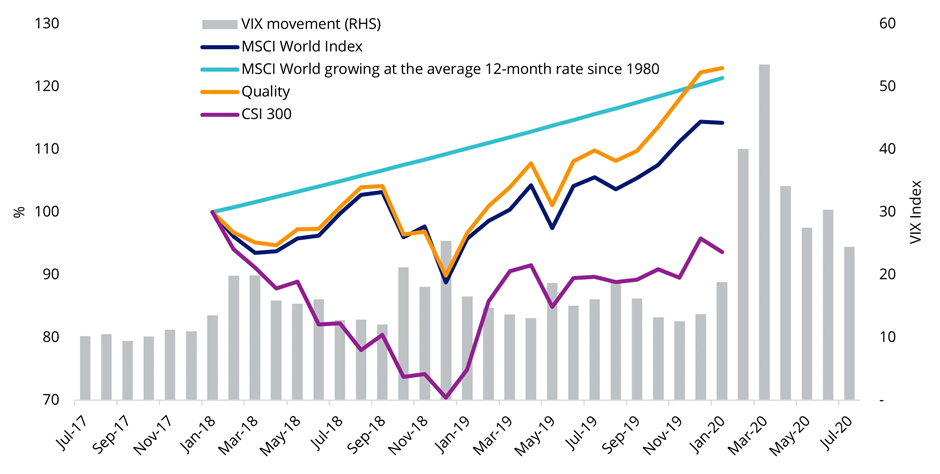
Source: VanEck, Bloomberg. Quality represented by the MSCI World Quality Index. VIX represented by CBOE Volatility Index. from July 2017 to July 2020. Main tariff impacted period from January 2018 to January 2020. You cannot invest in an index. Past performance is not indicative of future results.
Bush steel tariffs (2002–2003)
In 2002, President Bush imposed a 30% tariff on steel imports to protect domestic producers. The initiative backfired, resulting in higher steel prices that hurt US-based manufacturers and automakers, with an estimated 200,000 jobs lost, according to the Consuming Industries Trade Action Coalition (CITAC).
Impact on equities in sluggish growth environment: Bush’s tariffs were introduced in a highly turbulent environment, as markets were still reeling from the dot-com bubble. This created a far weaker backdrop for equities compared to the US-China tariff war in 2018-2019. Global equities saw a significant ~26% drawdown in Q4 2002, driven by rising costs, margin pressure, and deteriorating sentiment. Steel exporters, including Japan, China, faced sharp selloffs as reduced demand and margin pressure weighed on earnings. Quality companies, while following the broader trend, saw smaller drawdowns, reinforcing their defensive edge in uncertain markets.
Chart 2: Maximum drawdowns in impacted ex-US markets
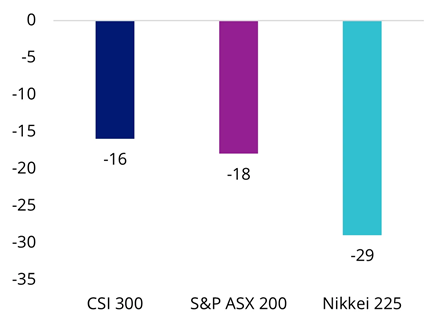
Source: VanEck, Bloomberg. Quality represented by the MSCI World Quality Index. VIX represented by CBOE Volatility Index. Data from March 2002 to December 2003. You cannot invest in an index. Past performance is not indicative of future results.
Chart 3: Global equities amid Bush Steel Tariffs
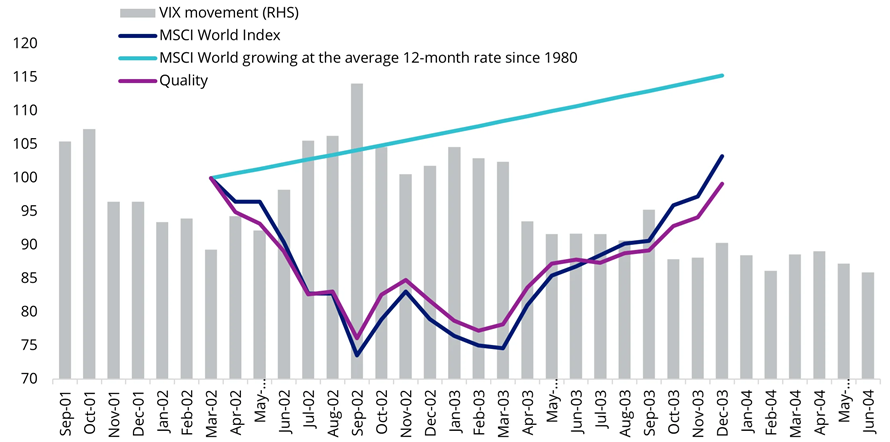
Source: VanEck, Bloomberg. Data from March 2002 to December 2003. You cannot invest in an index. Past performance is not indicative of future results.
The Smoot-Hawley agricultural tariffs (1930s)
President Hoover’s tariffs on agricultural products and related goods were introduced to protect farmers from foreign competition. The tariffs imposed by the Hoover administration triggered a global trade war, with major trade partners enforcing retaliatory tariffs, leading to a 66%1 collapse in world trade. The tariffs had a devastating effect on the US economy, deepening the global economic downturn known as the Great Depression.
Impact on equities in a deep recession: The S&P 500 index lost more than half of its value, while the Dow Jones, heavily weighted in industrials, collapsed. While we see this as an extreme scenario and consider a full replay in the Trump 2.0 era unlikely, it offers valuable lessons on the disruptive impact of an uncontrolled global trade war.
Taking a quality approach
Unlike expansionary markets where sentiment often takes the lead, we believe a tariff-driven environment calls for a sharper focus on company quality and diversification. As Trump unveils his broader trade strategy, prudent investors should be prepared for further market volatility and downside risk in the event of escalating trade tensions.
When sentiment-driven trades unravel, we believe corporate fundamentals matter most. Quality companies - those with strong ROE, earnings stability, and self-sufficiency - have historically shown greater resilience against downturns and times of uncertainty – reinforcing their defensive characteristics. In the chart below, the dark blue line represents international quality companies. When this line rises, it indicates that quality stocks are outperforming the market benchmark.
Chart 4: Quality has outperformed in times of volatility
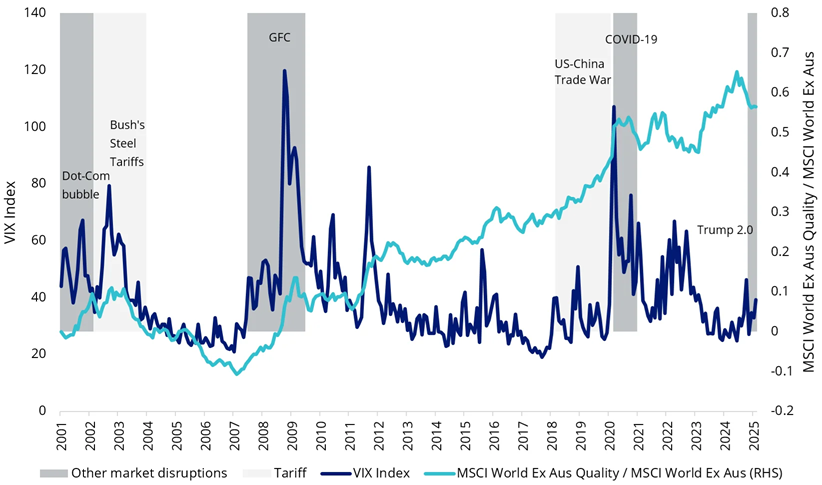
Source: VanEck, Bloomberg. Data from January 2001 to February 2025. Past performance is not indicative of future results. You cannot invest in an index. index performance is not illustrative of fund performance.
Source
1U.S. Department of State, Office of the Historian. The Smoot-Hawley Tariff and the Great Depression. U.S. Department of State. Web. 27 Feb. 2025. https://history.state.gov/milestones/1921-1936/protectionism.
Anna Wu is a Senior Associate, Cross-Asset Investment Research at VanEck, a sponsor of Firstlinks.
The VanEck MSCI International Quality ETF (QUAL) tracks the MSCI World ex Australia Quality Index and invests in around 300 of the world’s highest quality companies. A hedged version of QUAL is also available for investors.
This is general information only and does not take into account any person’s financial objectives, situation or needs. Any views expressed are opinions of the author at the time of writing and is not a recommendation to act.
For more articles and papers from VanEck, please click here.