Register For Our Mailing List

Register to receive our free weekly newsletter including editorials.

Home / 293

How is 2019 different from 2018?

The central bank policy of 'quantitative easiness' has morphed into simply ‘queasiness’. Certainly, that’s an apt feeling among investors following sharp falls in risk asset prices in the last quarter of 2018, again bringing into focus the question of asset allocation for the path ahead. While many of the surprise falls reversed, at least in part, through January 2019, it’s important to consider what may have driven the sharp declines. Are they symptomatic of a more prolonged malaise or a temporary setback?

It’s hard to ignore the secular shift in the comparable risk/reward metrics of major asset groups. Sharemarkets rewarded investors almost without missing a heartbeat in the entire post-GFC environment, buoyed by central bank monetary stimulus. The combination of a stable tiller and cheap money was an intoxicating mix. But now, perhaps if the initial US experience is anything to go by, we’re seeing for the first time in a long while the impact of having ‘the training wheels off’ and of borrowing costs moving back to a more normalised level, on a jittery equity market.

Fixed interest became relatively more interesting

What we are faced with today is a shifting set of relative market dynamics combined with a much less certain political landscape, with neither being especially ‘equity friendly’.

One thing that is arguably different now as we contemplate future asset allocations is the risk premia or simply the forecast return spread between cash and bonds, and equities. The ~1% cash rate return of the past decade was utopia for equities. Dividend yields of 4% or 5% made them the darling of any asset allocators tool kit. But now that cash rates in the US exceed 2%, the equity dividend yield return spread is less attractive.

And that’s before we factor in the tailwind that a rising rate environment ultimately brings to sovereign and credit yields. There may be some pain as rates rise if duration exposure is left unhedged, but the forward-looking returns from those bond assets today look more appealing. US 10-year Treasuries continue to oscillate around the 3% mark, and investment grade credit yields sit comfortably above 4% at the medium-to-long end of the curve.

The chart below illustrates the forward-looking benefit that the combination of sporadically widening spreads and rising rates - which characterized much of 2018 - provides to bond investors. They give higher yields across the maturity curve with no discernible elevation in the level of default risk. Suddenly, an equity dividend yield of even 5% doesn’t feel quite as rich, and certainly not on a risk- or volatility-adjusted basis.

Investment grade corporate bond yield curve

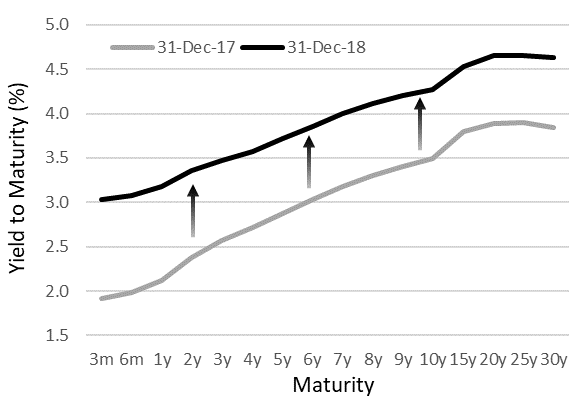
Source: Bloomberg as of 31/12/2018 using Bloomberg’s BVAL USD US Corporate Investment Grade Yield Curve. The yield curve is constructed using USD senior, unsecured fixed rate bonds issued by US investment grade companies. 

All this in a climate of political instability brought about by populism and anti-globalism and protectionism with the power to materially disrupt global trade and harmony, and an increasingly embattled Donald Trump.

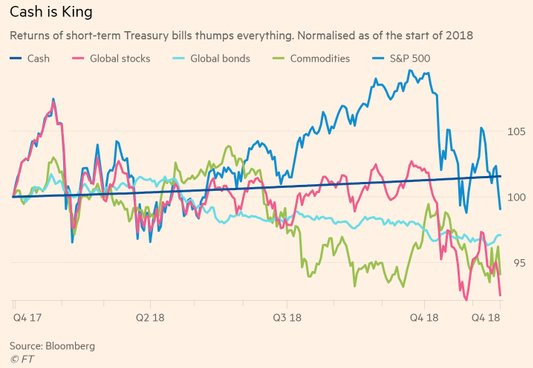
In 2018, defensive asset allocations won

After all the noise of 2018, those carrying the most defensive strategic asset allocations emerged victorious. It was a worthy reminder that through cycles there will always be periods where it pays to bias your objectives towards preserving money just as much as growing it. Regardless of whether risk asset volatility of the past couple of months proves to be temporary or more sustained, higher cash and bond yields signal a harder environment for equities to maintain the strong competitive edge that they have enjoyed over the past decade.

Chart 2: Short-term Treasuries top returns

However, our responsibility as investors to those that entrust their money to us means that we cannot sit idly by. This environment has developed as one where optimal balancing between prudent defense and sensible return-seeking becomes paramount.

To borrow from Nat King Cole, while there may be trouble ahead, we must face the music and dance. But perhaps from a safer point on the dance floor not too far from the exit should a hasty retreat become necessary.


James Bloom is Managing Director, Investor Relations at Kapstream Capital, an affiliate of Fidante Partners. This article is for general information, not financial advice. It has been prepared without taking into account any person's objectives.

Fidante is a sponsor of Cuffelinks. For more articles and papers from Fidante, please click here.

RELATED ARTICLES

5 insights that put market volatility in perspective

Is FOMO overruling investment basics?

Fear is good if you are not part of the herd

banner

Most viewed in recent weeks

Are LICs licked?

LICs are continuing to struggle with large discounts and frustrated investors are wondering whether it’s worth holding onto them. This explains why the next 6-12 months will be make or break for many LICs.

Retirement income expectations hit new highs

Younger Australians think they’ll need $100k a year in retirement - nearly double what current retirees spend. Expectations are rising fast, but are they realistic or just another case of lifestyle inflation?

Welcome to Firstlinks Edition 627 with weekend update

This week, I got the news that my mother has dementia. It came shortly after my father received the same diagnosis. This is a meditation on getting old and my regrets in not getting my parents’ affairs in order sooner.

  • 4 September 2025

5 charts every retiree must see…

Retirement can be daunting for Australians facing financial uncertainty. Understand your goals, longevity challenges, inflation impacts, market risks, and components of retirement income with these crucial charts.

Why super returns may be heading lower

Five mega trends point to risks of a more inflation prone and lower growth environment. This, along with rich market valuations, should constrain medium term superannuation returns to around 5% per annum.

Super crosses the retirement Rubicon

Australia's superannuation system faces a 'Rubicon' moment, a turning point where the focus is shifting from accumulation phase to retirement readiness, but unfortunately, many funds are not rising to the challenge.

Latest Updates

Investment strategies

Why I dislike dividend stocks

If you need income then buying dividend stocks makes perfect sense. But if you don’t then it makes little sense because it’s likely to limit building real wealth. Here’s what you should do instead.

Superannuation

Meg on SMSFs: Indexation of Division 296 tax isn't enough

Labor is reviewing the $3 million super tax's most contentious aspects: lack of indexation and the tax on unrealised gains. Those fighting for change shouldn’t just settle for indexation of the threshold.

Shares

Will ASX dividends rise over the next 12 months?

Market forecasts for ASX dividend yields are at a 30-year low amid fears about the economy and the capacity for banks and resource companies to pay higher dividends. This pessimism seems overdone.

Shares

Expensive market valuations may make sense

World share markets seem toppy at first glance, though digging deeper reveals important nuances. While the top 2% of stocks are pricey, they're also growing faster, and the remaining 98% are inexpensive versus history.

Fixed interest

The end of the strong US dollar cycle

The US dollar’s overvaluation, weaker fundamentals, and crowded positioning point to further downside. Diversifying into non-US equities and emerging market debt may offer opportunities for global investors.

Investment strategies

Today’s case for floating rate notes

Market volatility and uncertainty in 2025 prompt the need for a diversified portfolio. Floating Rate Notes offer stability, income, and protection against interest rate risks, making them a valuable investment option.

Strategy

Breaking down recent footy finals by the numbers

In a first, 2025 saw AFL and NRL minor premiers both go out in straight sets. AFL data suggests the pre-finals bye is weakening the stranglehold of top-4 sides more than ever before.

Sponsors

Alliances

© 2025 Morningstar, Inc. All rights reserved.

Disclaimer
The data, research and opinions provided here are for information purposes; are not an offer to buy or sell a security; and are not warranted to be correct, complete or accurate. Morningstar, its affiliates, and third-party content providers are not responsible for any investment decisions, damages or losses resulting from, or related to, the data and analyses or their use. To the extent any content is general advice, it has been prepared for clients of Morningstar Australasia Pty Ltd (ABN: 95 090 665 544, AFSL: 240892), without reference to your financial objectives, situation or needs. For more information refer to our Financial Services Guide. You should consider the advice in light of these matters and if applicable, the relevant Product Disclosure Statement before making any decision to invest. Past performance does not necessarily indicate a financial product’s future performance. To obtain advice tailored to your situation, contact a professional financial adviser. Articles are current as at date of publication.
This website contains information and opinions provided by third parties. Inclusion of this information does not necessarily represent Morningstar’s positions, strategies or opinions and should not be considered an endorsement by Morningstar.