Register For Our Mailing List

Register to receive our free weekly newsletter including editorials.

Home / 636

An obsessive focus on costs may be costing investors

The Australian investment landscape is set for another skirmish in the ongoing fee war. Recently, a new ASX300 exchange-traded fund launched with an expense ratio of 0.04%, challenging the incumbent and its 0.07% fee. Online, the excel models are already running hot in a ferocious contest over three-hundredths of a percentage point – a sum amounting to $30 a year on a $100,000 portfolio.

This forensic obsession with cost is not an accident. It is the natural result of a doctrine that has come to dominate modern finance: that the optimal path is paved with passive, market cap-weighted index funds. It is a philosophy that champions simplicity and low cost above all, offering an elegant solution that has become the comfortable default for millions. However, this narrow focus on explicit costs can create a significant opportunity cost, distracting from a far more consequential question.

What if the construction of the index itself is a more powerful driver of returns than the fee paid to track it? To question this default setting is often viewed as heresy. Let’s test the hypothesis.

In this article I will take the industry’s conventional benchmarks and assess them against their factor-tilted challengers. To ensure a robust comparison, we will deliberately handicap the challengers, subjecting them to their higher fees and a drag for trading costs – a penalty their cap-weighted parents do not pay. This creates a deliberately high hurdle for the factor strategies to overcome.

The results are illuminating.

The terms of engagement

Note: To avoid venturing into the world of financial advice I have avoided directly mentioning the underlying products that track these indices.

Here is exactly how I applied the expenses, ensuring a comparison grounded in real-world costs.

Each Index was debited a Management Expense Ratio (MER). The MSCI World Index parent portfolio was charged a 0.18% annual fee, while the MSCI World Factor Mix A-Series Index challenger paid the same 0.18%. Next came the handicap, applied only to the factor-tilts. On top of its MER, the Factor Mix A-Series was charged an additional 0.20% per annum 'turnover penalty' to account for the higher turnover costs of rebalancing its holdings.1

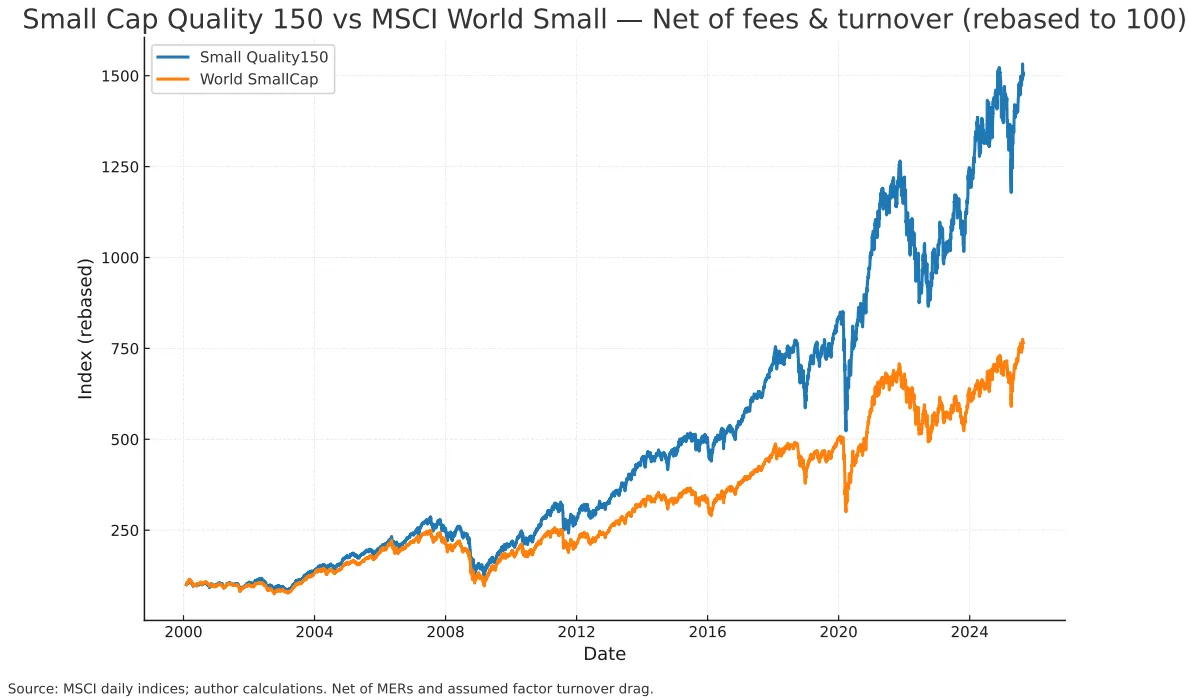
This asymmetric penalty was even harsher in other segments. In small caps, the MSCI World Small Cap Index is charged a 0.45% MER. The Small-Cap Quality Index factor-tilt is charged a higher 0.59% MER plus a 0.30% turnover drag.

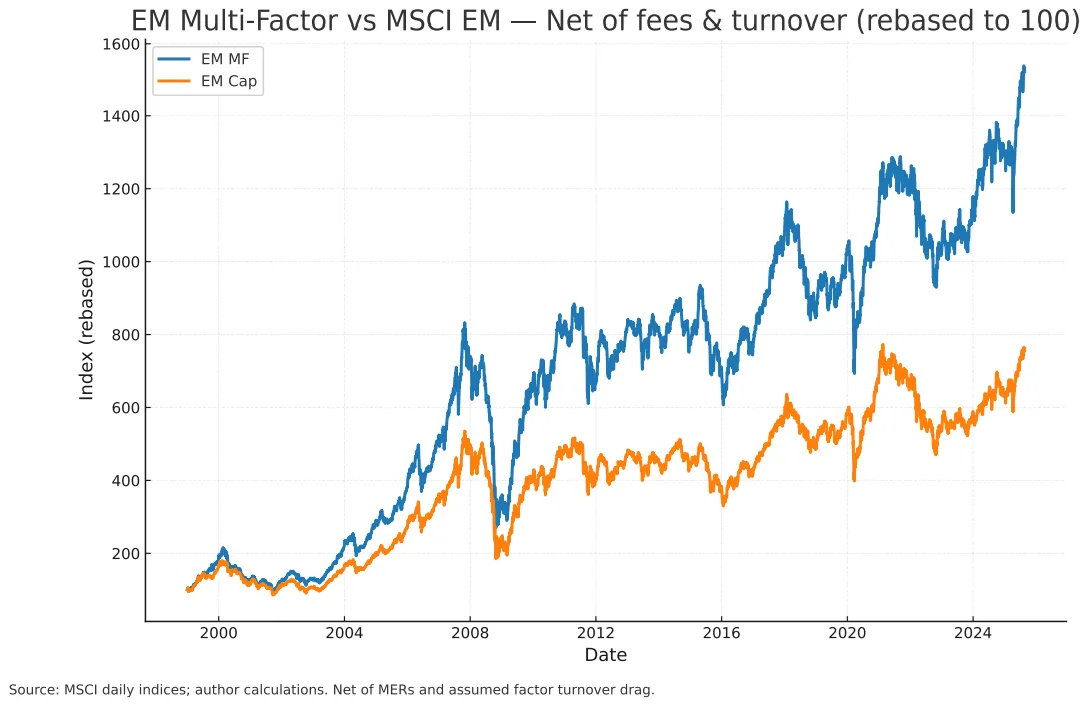
In emerging markets, the MSCI Emerging Markets Index pays 0.48%. The MSCI Emerging Markets Multi-Factor Index challenger is charged 0.69% plus another 0.30% turnover drag.

The factor portfolios were thus forced to compete under a realistic yet conservative cost disadvantage.

A consistent pattern of outperformance

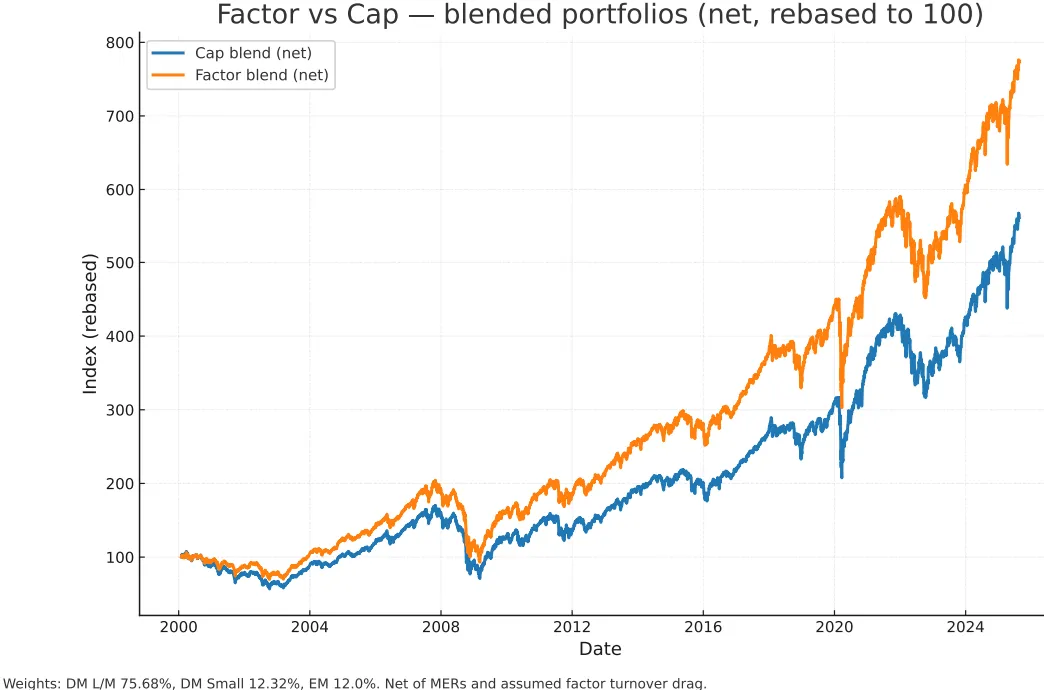
Let us begin with a globally blended portfolio, reflecting a typical investor allocation (75.68% developed markets, 12.32% small-cap, 12.0% EM). After all fees and tax-drags, the factor blend compounded at 8.36% per year. The conventional cap-weighted blend returned 7.01%.

This divergence resulted in the factor-tilted portfolio generating an annualised alpha of 1.8%, achieved with a superior risk-adjusted return (Sharpe ratio of 0.62 vs 0.50).

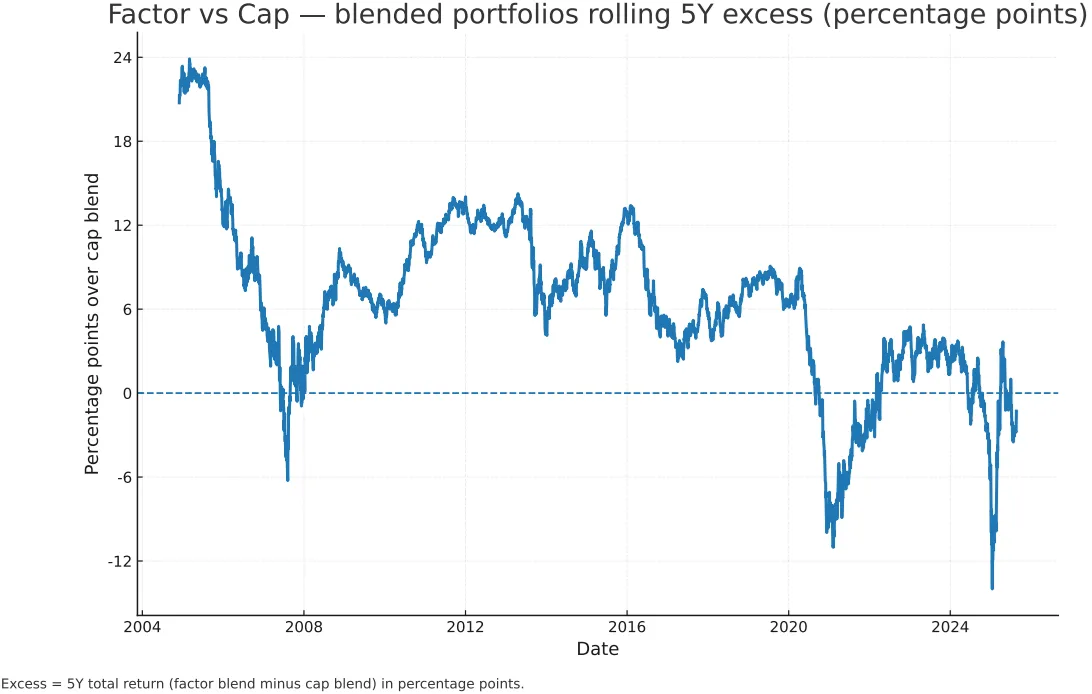
The factor-weighted portfolio outperformed the market cap weighted portfolio 87% of the time (based on 5-year rolling periods).

The outcome becomes clearer when inspecting the individual segments:

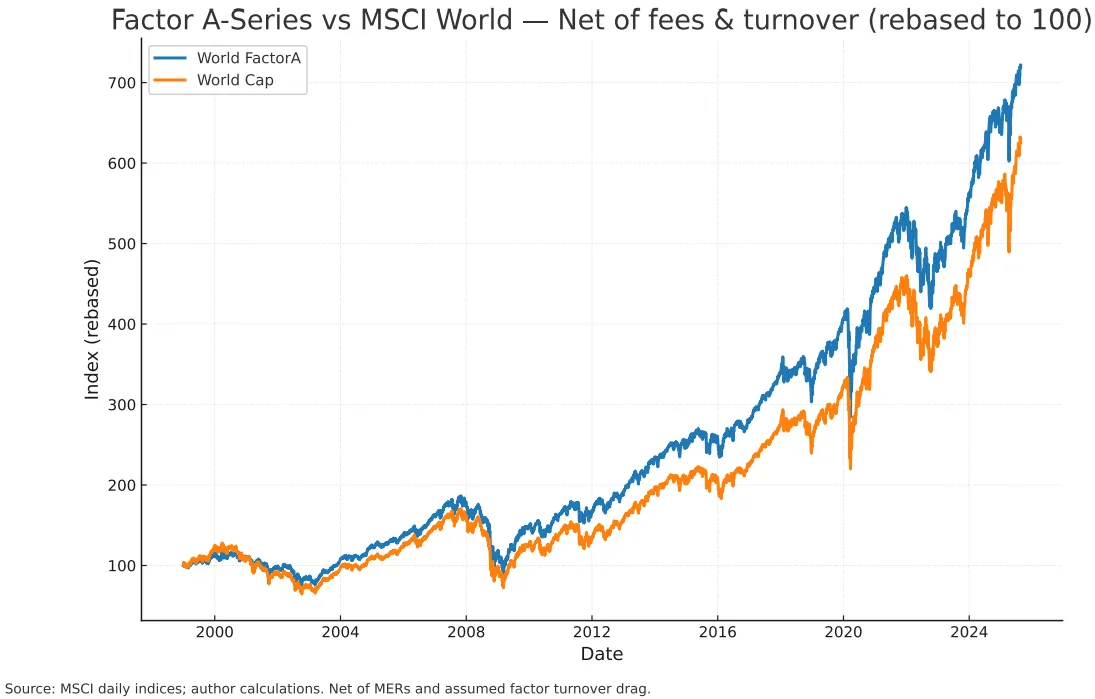
  • Developed Markets: From 1 Jan 1999 to 21 Aug 2025, the MSCI World Factor A-Series delivered a net return of 7.69% to the parent’s (MSCI World) 7.13%, achieving this with a lower beta (0.87) (higher risk adjusted returns) and generating an annualised alpha of over 1.2%.
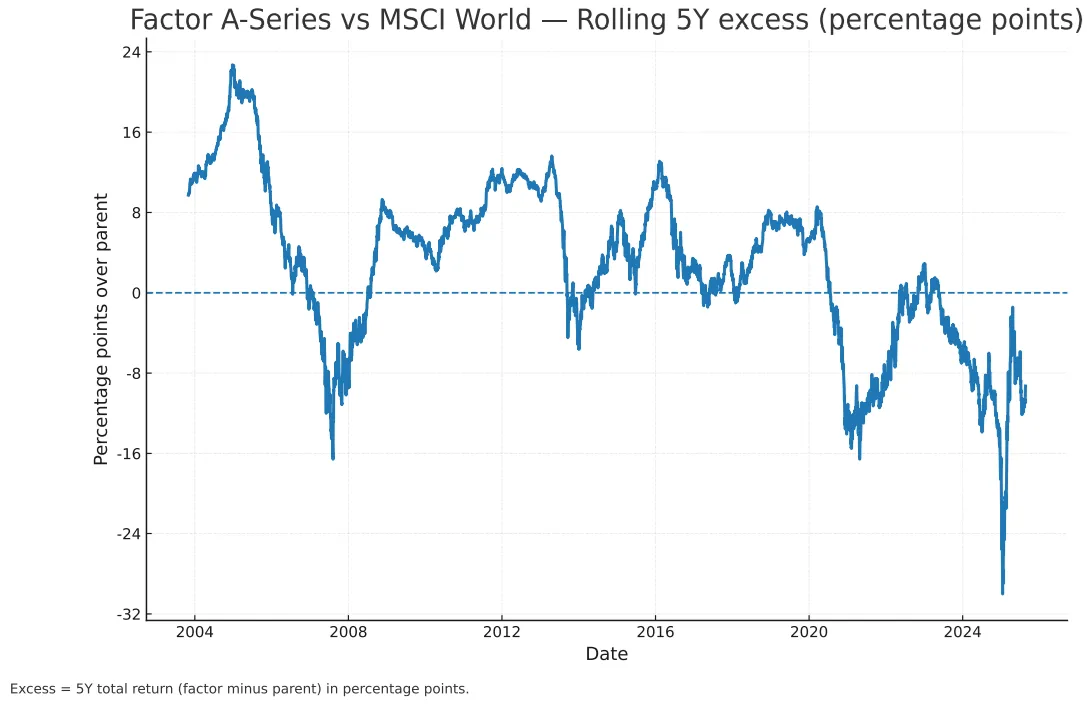
    The multi-factor option outperformed the market-cap weighted methodology 68% of the time.

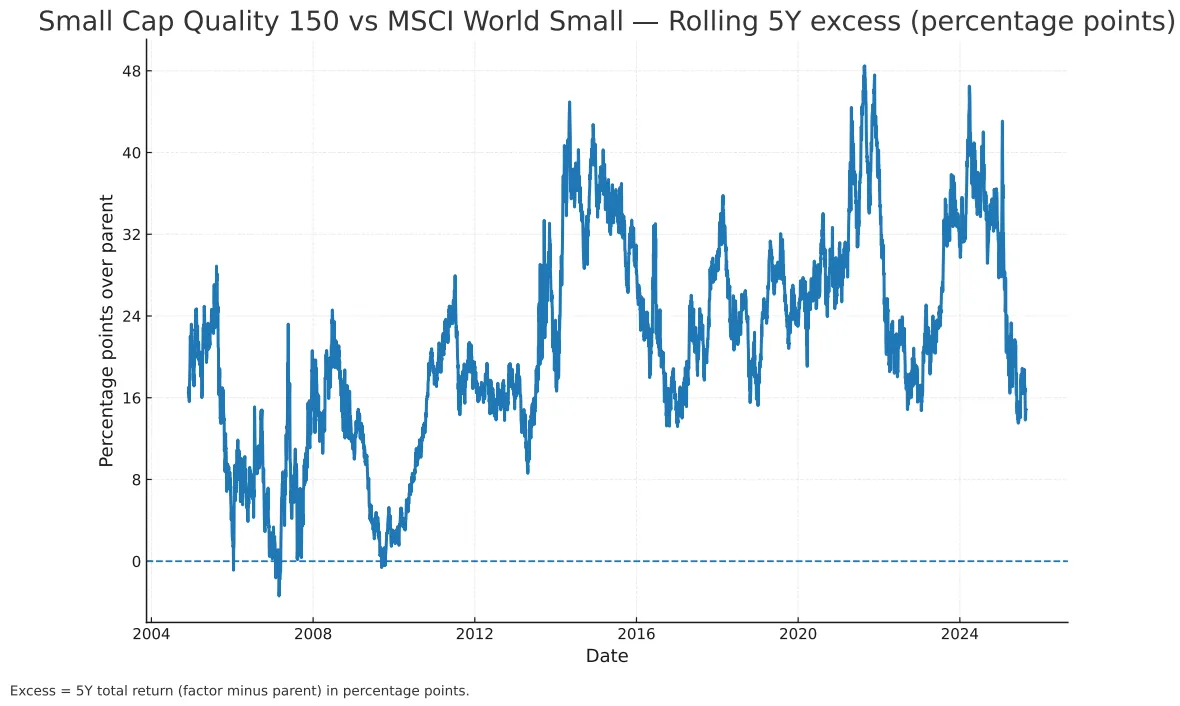
  • Small-Caps: The effect was most pronounced here2. Since 1 Feb 2000, the MSCI World Small-Cap Quality Top 150 Index3 returned a net 11.23% per year, decisively outpacing the parent’s (MCSI World Small Cap) 8.32%.
    The quality-tilted small cap portfolio outperformed in 99% of all rolling five-year windows.

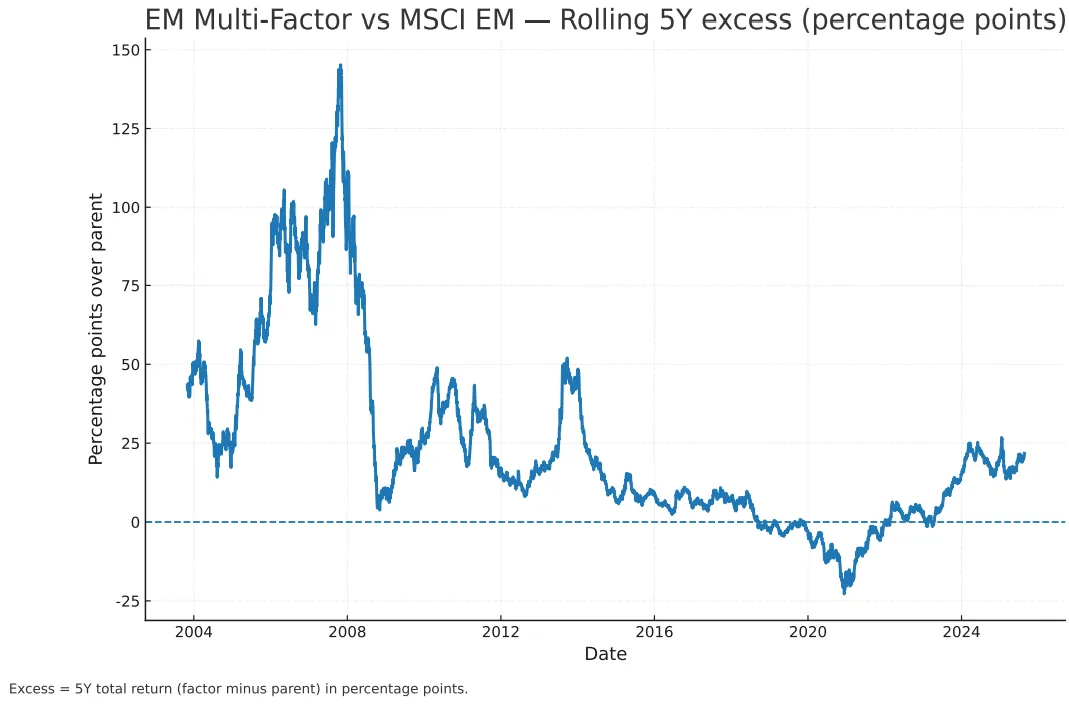
  • Emerging Markets: Even in this notoriously opaque segment, and after being charged nearly 1% in MER + turnover drag, the multi-factor challenger delivered 10.77% versus the parent’s 7.89%, winning in 85% of rolling five-year periods.4

The method behind the outperformance

These results are not a statistical accident. They are the outcome of strategies designed to harvest well-documented, academically rigorous sources of return known as 'factors'. The indices used in this analysis deliberately target exposures to Size, Value, Quality/Profitability, Low-Volatility, and Momentum – effects with decades of cross-market evidence first popularised by academic researchers Eugene Fama and Kenneth French.

The persistence of these factor premia is typically attributed to two main theories:

1. Risk-based explanations: These theories posit that the Capital Asset Pricing Model (CAPM) is incomplete, suggesting that other sources of systematic, undiversifiable risk exist beyond simple market exposure (beta). From this perspective, factor premia are the rational compensation investors demand for bearing these additional risks.

The Value premium, for instance, is often linked to 'financial distress' risk; value companies tend to be more mature, may have higher leverage, and are often more vulnerable to economic downturns. Their lower valuations reflect this heightened risk, and the premium is the reward for holding these stocks through periods of uncertainty.

Similarly, the Size premium is considered compensation for the risks inherent in smaller companies, which typically have less diversified revenue streams, more limited access to capital, and higher sensitivity to the business cycle compared to their larger counterparts. According to this view, the long-term outperformance of value and small-cap stocks is not a market inefficiency, but a fair payment for bearing specific economic risks not captured by market beta alone.

2. Behavioural explanations: Alternatively, behavioural theories argue that factor premia are the result of persistent and predictable cognitive biases among market participants. These systematic errors in judgment lead to mispricings that a disciplined strategy can systematically exploit. For example, the Value premium may be driven by overconfidence where investors become overly optimistic about 'glamour' growth stocks with compelling narratives, pushing their prices to unsustainable levels. The same extrapolation biases can fuel the Momentum premium, as investors project recent price trends far into the future.

The Quality and Low-Volatility anomalies are often attributed to a 'preference for lotteries', (such as 'meme-stocks' or eye-watering valuations for AI-adjacent stocks) where investors are drawn to speculative, high-risk stocks in the hope of outsized gains, causing them to overpay for these volatile assets. Consequently, stable, profitable companies tend to be systematically underpriced relative to their risk. From this viewpoint, factor investing is a form of arbitrage, capitalizing not on risk, but on the enduring patterns of human psychology.

Modern index construction is engineered to maximise exposure to these factors while implementing rules that contain turnover and minimise trading costs, which is why the real-world performance has remained robust.

The price of a differentiated return

This outperformance is not, however, always a 'free lunch'. There are extended periods where a factor-tilted approach will underperform a cap-weighted benchmark. When a market becomes fixated on a narrow group of glamour stocks – as it did with US tech megacaps from 2019 to 2024 – any diversified strategy is guaranteed to lag. These 'factor winters' are the price of admission for accessing the long-term premium.

A sceptic might correctly observe that the data presented here, from 1999 to the present, represents a mere quarter-century – a significant but not exhaustive period in financial history. However, it would be a mistake to assume these factor premia are a recent phenomenon.

The academic foundations for these strategies are built upon evidence that stretches back much further. The Fama-French three-factor model, a cornerstone of modern financial economics, documented the persistence of the Value and Size premia in US markets with data reaching as far back as 1926. Similar long-term studies across various international markets have repeatedly confirmed the robustness of these effects – including Momentum, Quality, and Low Volatility – over many decades and through numerous economic regimes. The outperformance shown in this analysis is therefore not an isolated anomaly of the modern era, but rather a recent confirmation of some of the most persistent and well-documented sources of return in financial history.

It is also worth noting the current state of the discourse. While the financial media and online forums fixate on a narrow cohort of popular technology stocks or the minutiae of cap-weighted fund fees, the academically robust factors such as value, size, and low volatility remain deeply unfashionable. In the world of investing, this is rarely a bad sign. Historically, the most rewarding returns are not found in the most crowded trades but in the most neglected ones. A lack of popular enthusiasm is often a harbinger of higher potential returns, as the premia associated with these strategies are not being competed away by a stampeding herd.

The debate over a few basis points on a management fee will continue to rage. It is, after all, a simple and tangible metric to anchor on. But the data presented here suggests it is a profoundly misguided obsession. The true cost of an investment is not found in the fractions of a per cent listed on a fact sheet, but in the percentage points of performance left on the table by choosing a suboptimal index. The conventional, cap-weighted portfolio may be the cheapest and simplest path, but the evidence is clear: it is far from the most profitable one.


1 The additional turnover penalties of +0.20% p.a. for the A-Series and +0.30% p.a. for the Small-Cap Quality and EM Multi-Factor sleeves were chosen as all-in estimate of implementation costs based on three observations. First, MSCI's factor indices are explicitly engineered with buffers and constraints to moderate turnover, making them cost-efficient to implement. Second, empirical studies of transaction costs show that realised costs for broad, rules-based equity strategies are typically in the low tens of basis points annually, meaning the 20-30 bps assumption is a reasonable and not aggressive overlay (see AQR article) Finally, real-world tracking differences for passive funds often hew closely to their MER, as managers can offset trading friction through techniques like internal crossing and securities lending. Therefore, applying an additional 20-30 bps penalty on top of the MER serves as a reasonable safety margin.
2 See the litany of research showing how the increasing “junkiness” of the small-cap market-weighted indices creates a significant drag.
3 The small cap quality factor used here is ex-Australia, compared to an index which includes Australia. I think this is negligible in terms of its effect on the discussion at hand.
4 There is significant research that adding a factor tilt to EM that re-weights shareholder returns (Quality, Dividend Yield/Value) helps with the ongoing dilution/issuance drag associated with EM exposure.


“Macro Torque” is an Australian Engineer (with a Finance Masters) who writes about Finance and Economics. This article is reproduced with permission from the Macro Torque substack blog (@macrotorque).


  •   5 November 2025
  • 8
  •      
  •   
8 Comments
Chris Brycki - Stockspot
November 06, 2025

The idea that “factor investing” can deliver better long-term returns sounds great in theory. But in practice, there’s little proof that factors which worked in the past keep working in the future.

Once a factor becomes popular, studied and sold through ETFs and other product structures the advantage quickly disappears. What started as an inefficiency gets competed away as more investors pile in.

That’s exactly what’s happened with the so-called proven factors like value and size. They were well known by the 1990s thanks to Fama/French, then became the foundation for hundreds of new funds and indices. Since then, value has underperformed for much of the past twenty years. The size factor has struggled too once you adjust for liquidity and risk.

The reason is simple. The more investors crowd into a factor, the lower its future returns become. Every extra dollar chasing the same signal pushes prices up and squeezes out the opportunity.

Factor investing ends up being a victim of its own popularity.

Even the academics who first discovered these patterns now admit the returns fade over time. McLean and Pontiff’s 2016 study, Does Academic Research Destroy Stock Return Predictability? found that once a factor was published, its extra return dropped by more than half. (https://onlinelibrary.wiley.com/doi/10.1111/jofi.12365)

The recent decade has been a clear example. A review by Robeco covering 2010–2019 found that the combined premium from the classic Fama–French factors (size, value, profitability, and investment) averaged -0.28% per year, compared with +3.95% per year over 1963–2009 (https://www.robeco.com/files/docm/docu-robeco-factor-performance-2010-2019-a-lost-decade.pdf).

A paper by MSCI noted that over the last ten years, four out of seven single-factor indexes underperformed the broad market by 2.6% to 3.5% annually, with enhanced value lagging the most (https://www.msci.com/downloads/web/msci-com/research-and-insights/paper/factor-indexing-through-the-decades/factor-indexing-through-the-decades.pd). Only momentum, quality and growth outperformed during this period

A study by FTSE Russell reached a similar conclusion: after stripping out off-target exposures, the US “pure” value factor showed almost zero excess return over the long term, with particularly weak results in recent years. (https://www.lseg.com/content/dam/ftse-russell/en_us/documents/research/comparing-value-factor-performance-gobal-equity-markets.pdf).

It’s also worth remembering that market-cap weighting already reflects all these factors. Every stock’s weight in an index represents the combined view of millions of investors about its size, value, quality, and momentum. A cap-weighted index isn’t a “no-factor” approach. It’s an “all-factor” approach. It automatically adjusts as markets change, without trying to guess which factor will work next.

None of this means factors never work. They do, at times. But they don’t work consistently, and rarely after they become mainstream.

Their supposed long-term “premiums” tend to shrink or vanish once enough investors start chasing them.

So chasing yesterday’s factors is no different from chasing yesterday’s hot funds. The promise of future outperformance usually disappears the moment everyone hears about it.

While factors come and go, costs are forever. For investors the smartest approach is to stay diversified, disciplined, and low cost. The only real free lunch in investing isn’t a factor, it’s diversification!

4
Lauchlan Mackinnon
November 06, 2025

Chris,

Thanks for your thoughtful comments on factor investing. I'll chase up some of those references.

Re "While factors come and go, costs are forever" - while the article does focus on factors in its examples, I think its point isn't confined only to the standard company factors of value, size, momentum, quality, and low volatility. The article concludes with a more general statement:

"The debate over a few basis points on a management fee will continue to rage ... it is a profoundly misguided obsession. The true cost of an investment is not found in the fractions of a per cent listed on a fact sheet, but in the percentage points of performance left on the table by choosing a suboptimal index."

It seems fairly evident to me that different indices do in fact return different performance results. For example, The ASX 200 has one long term performance record over 10, 20 or 30 years. The S&P 500 has a different performance record over that period. The NASDAQ 100 has another.

Picking an index along these lines does not require taking a factor-based approach - it can be more picking a region (e.g. USA vs Australia), industry sector (e.g. tech, defence), or an asset class.

I think the broader point in the article can still stand, even if your thoughtful points about factor investing are correct. It's basically just restating the centrality of asset allocation to the investing outcome.

1
Chris Brycki - Stockspot
November 06, 2025

Hi Lauchlan, thanks for your reply.

I completely agree on the importance of asset allocation... it’s the single biggest driver of long-term returns. Stockspot was actually built on that exact thesis. Our portfolios use just five broad, market-cap weighted ETFs to give clients simple, diversified exposure across asset classes, without trying to outsmart the market.

You’re also right that different indices and markets produce different results over time. That’s simply the outcome of asset allocation choices (region, sector, or asset class) not evidence that one index construction method is inherently “suboptimal”.

The issue I have with the article is that it frames these performance differences as proof that some indices are “better built” than others, when in reality most of the return variation comes from exposure to different underlying risk premia or market segments. Once you strip out those tilts, what remains is largely market beta.

That’s why I pushed back on the idea that the real cost of investing lies in “choosing a suboptimal index”. The evidence shows the opposite.. most attempts to improve on simple, broad-market exposure end up costing investors more in fees, taxes, and turnover than they gain in excess return. Factors, styles, and alternative index constructions all go through cycles of outperformance and underperformance, but higher costs are permanent.

So yes, different indices will always produce different results, but that doesn’t mean investors can reliably pick the “better” one ahead of time. History has shown it’s almost impossible to do consistently, which is exactly why low-cost diversification still tends to win over the long run.

2
Lauchlan Mackinnon
November 07, 2025

Hi Chris,

I took “choosing a suboptimal index” to mean picking an index that would lead to poorer results relative to ones goals, not a comment on any particular index methodology. I may have misread that though, there was a lot of content in the article.

Re "So yes, different indices will always produce different results, but that doesn’t mean investors can reliably pick the “better” one ahead of time." - I think that (long term) investors often CAN pick better ones ahead of time, for precisely the reason that stocks are regarded as a higher growth asset class over time over bonds ... because historically they have been better performers over long periods. While the future does not predict the past, there isn't any better indicator for the future for an asset class than I know of than long-term performance data.

For example, Vanguard chart this out https://fund-docs.vanguard.com/AU-Vanguard_Index_Chart_poster.pdf, and over 30 years US shares averaged 10.8% p.a. growth, Australian shares 9.3% p.a., and Australian bonds 5.5% p.a.

Books such as Stocks For the Long Run chart this out for the last century or so, and there is a demonstrable long-term difference in performance.

You may have a different view, but to me I think it's a pretty safe bet that - barring the current US leadership really messing up, which seems quite possible now and leads to genuine uncertainty around the future - it would be the same kind of performance difference between the asset classes over the next 30 years.

So if an individual investor is comfortable with volatility and has a long-term outlook, from this point of view a 100/0 portfolio is better than a 60/40 one - it avoids watering down equities growth with bonds just to try to improve volatility, which in itself is not the goal for the portfolio (growth is). Funds of course don't have that option, as members may want to cash out at any time, so they do need to manage for volatility. That's an edge to the individual investor who knows their goals and volatility tolerance.

That's picking winners among asset classes, and there is a good justification for doing so.

Lauchlan Mackinnon
November 07, 2025

An additional note: I think we're basically saying the same thing, that "different indices and markets produce different results over time. That’s simply the outcome of asset allocation choices (region, sector, or asset class)"

I think where I'm in a slightly different place is around saying this is "not evidence that one index construction method is inherently “suboptimal”."

I think that all indices are basically choosing one asset class or another (region, sector for equities; one-element ETFs for bitcoin or gold; etc), even smart beta ETFs. And I think we can often pick long term winners.

But not always - the more concentrated the index is, the more risk there is (e.g. an ETF constructed around an index of only holding bitcoin is vulnerable to the value of bitcoin collapsing to zero, which makes it more risky than gold which still has some kind of embedded fundamental value).

1
Macro Torque
November 07, 2025

Chris,
Thank you so much for taking the time to read the article and provide such a detailed, thoughtful comment. It’s a really important contribution to the discussion, and you’ve perfectly articulated the most robust and common critique of factor investing. I genuinely appreciate the engagement.

I think where our perspectives primarily diverge is on the premise that factor premia are "competed away" post-publication. That’s a very fair critique, and it would be 100% true if these factors were just a pure, risk-free arbitrage that could be exploited to death.

But as you know, the academic case for factors (from Fama/French themselves) rests on them being compensation for persistent risk or enduring behavioural biases. The premium for Value or Size, for example, is partly compensation for bearing very real, non-diversifiable risks like cyclicality, financial distress, or illiquidity. An ETF buying a value stock doesn't magically de-lever that company's balance sheet or make it less vulnerable to an economic downturn.

Similarly, the behavioural biases underpinning Momentum and Quality—our human preference for "lottery ticket" glamour stocks over "boring" profitable companies, or our tendency to extrapolate recent trends—are deep-seated features of market psychology, not temporary bugs that an academic paper can patch.
This is where I find the body of research from groups like AQR so compelling. Their work on factor persistence (e.g., in papers like "Fact, Fiction, and Factor Investing") argues persuasively that these premia have survived decades of intense academic and practitioner scrutiny precisely because they are not a free lunch. They are, in theory, a rational reward for bearing specific, uncomfortable risks that many investors are unwilling (or unable) to hold.

You are absolutely right to point to the 2010s "lost decade" as a painful period for factors, and the research you've cited from Robeco, MSCI, and FTSE Russell captures that. It's a critical data point. But I’d argue this cyclicality is a feature, not a bug. It's the very "price of admission" for accessing the long-term premium. If factors outperformed every single year, there would be no risk and, therefore, no reward. My concern is that using this single, tough decade—a period defined by historic mega-cap concentration—as a new baseline for the next 30 years might be a form of recency bias.

This is also why my analysis focused on a multi-factor blend. Your MSCI citation correctly noted that single factors like "pure value" struggled, but it also admitted that Quality and Momentum held up. That, to me, supports the case for diversifying across factors, which is the logical solution to the very problem those papers identify.

In fact, the main finding of my article was that my blended factor portfolio still outperformed by 1.8% annually over the full 25+ years—a period that includes that entire "lost decade" headwind.

This also addresses the McLean and Pontiff (2016) paper you shared. It's a great paper and it's spot-on: implementation costs absolutely reduce raw returns. That's precisely why I didn't use a raw academic backtest. I deliberately handicapped the factor portfolios with their actual higher MERs plus an explicit 20-30 bps "turnover penalty." The fact that the factor blend still came out ahead, even after accounting for these real-world, post-publication costs, is what I found so compelling.

Perhaps our other main point of divergence is on the nature of market-cap indexing. You framed it as an "all-factor" approach. I tend to see it differently. An MCW index, by its very construction, is a single market factor bet—one with a permanent, structural tilt towards large-cap momentum and against value and size.

You suggest that the market portfolio already reflects the markets beliefs of the size, value, quality and so forth of each company in the index - but this does not account for the exact behavioural biases that many of these factors (momentum, quality, minimum volatility, value etc…) rely on.

This is a key distinction, because as you know, these multi-factor funds hold the exact same universe of stocks as the broad index. They are just re-weighting them. They are simply moving away from the incidental, concentrated bets of an MCW fund and towards capturing more diversified sources of return. I would argue that the Multi-Factor A Series Index which I referenced in my article which holds all the MSCI World companies, but with top 20 holdings being a much much smaller total index weight is much more diversified.

This all loops back to my original thesis. You are 100% right that "costs are forever," but the evidence I've found suggests that index construction matters even more. The 1.8% annual performance gap I found over 25 years is a much larger driver of long-term wealth than the 3-7 basis points saved in fees.

My concern is simply that in our forensic (and necessary) obsession with a few basis points, we may be overlooking the percentage points left on the table by a structurally suboptimal, if cheap, benchmark.

Again, I really appreciate the thoughtful critique. It’s a crucial debate to be having.

Thanks!
Macro Torque

4
Lauchlan Mackinnnon
November 06, 2025

This is such a great point.

Here's a case example:

NDQ

Betashares NDQ ETF https://www.betashares.com.au/fund/nasdaq-100-etf/ tracks the NASDAQ 100.

Its management fee is 0.48%.
Its annual growth per annum over the last ten years (as of 6/11/25) is 20.51%.

IVV

IShares IVV https://www.ishares.com/us/products/239726/ishares-core-sp-500-etf is another ETF with a high historical return, it tracks the S&P 500.
Its management fee is 0.03%
Its annual growth per annum over the last ten years (as of 6/11/25) is 15.26%.

Both are good ETFs (in my view, I am not a financial advisor). NDQ's management fee is clearly MUCH higher than IVVs.

But if you're going to choose between one or the other in your portfolio (you don't have to, you can include both) then the management fee shouldn't be the major consideration in my view. It's the net growth p.a. (after fees) over longer time periods that matters, along with other considerations such as its volatility and risk of exposure to downturns that are the key considerations.

To the article's point: low management fees can be overemphasised when picking between growth ETFs.

3
Rod in Oz
November 06, 2025

Good point Lauchlan Mackinnon - I completely agree!


Leave a Comment:

RELATED ARTICLES

Mapping future US market returns

Are markets broken?

Three ways index investing masks extra risk

banner

Most viewed in recent weeks

The growing debt burden of retiring Australians

More Australians are retiring with larger mortgages and less super. This paper explores how unlocking housing wealth can help ease the nation’s growing retirement cashflow crunch.

Four best-ever charts for every adviser and investor

In any year since 1875, if you'd invested in the ASX, turned away and come back eight years later, your average return would be 120% with no negative periods. It's just one of the must-have stats that all investors should know.

LICs vs ETFs – which perform best?

With investor sentiment shifting and ETFs surging ahead, we pit Australia’s biggest LICs against their ETF rivals to see which delivers better returns over the short and long term. The results are revealing.

Warren Buffett's final lesson

I’ve long seen Buffett as a flawed genius: a great investor though a man with shortcomings. With his final letter to Berkshire shareholders, I reflect on how my views of Buffett have changed and the legacy he leaves.

Family trusts: Are they still worth it?

Family trusts remain a core structure for wealth management, but rising ATO scrutiny and complex compliance raise questions about their ongoing value. Are the benefits still worth the administrative burden?

13 ways to save money on your tax - legally

Thoughtful tax planning is a cornerstone of successful investing. This highlights 13 legal ways that you can reduce tax, preserve capital, and enhance long-term wealth across super, property, and shares.

Latest Updates

Financial planning

How much does it really cost to raise a child?

With fertility rates at a record low, many say young people aren’t having kids because they’re too expensive. Turns out, it’s not that simple and there are likely other factors at play.

Exchange traded products

Passive ETF investors may be in for a rude shock

Passive ETFs have become wildly popular just as markets, especially the US, reach extreme valuations. For long-term investors, these ETFs make sense, though if you're investing in them to chase performance, look out below.

Shares

Bank reporting season scorecard November 2025

The Big Four banks shrugged off doomsayers with their recent results, posting low loan losses, solid margins, and rising dividends. It underscores their resilience, but lofty valuations mean it’s time to be selective. 

Investment strategies

The real winners from the AI rush

AI is booming, but like the 19th-century gold rush, the real profits may go to those supplying the tools and energy, not the companies at the centre of the rush.

Economy

Why economic forecasts are rarely right (but we still need them)

Economic experts, including the RBA, get plenty of forecasts wrong, but that doesn't make such forecasts worthless. The key isn't to predict perfectly – it's to understand the range of possibilities and plan accordingly.

Strategy

13 reflections on wealth and philanthropy

Wealth keeps growing, yet few ask “how much is enough?” or what their kids truly need. After 23 years in philanthropy, I’ve seen how unexamined wealth can limit impact, and why Australia needs a stronger giving culture.

Sponsors

Alliances

© 2025 Morningstar, Inc. All rights reserved.

Disclaimer
The data, research and opinions provided here are for information purposes; are not an offer to buy or sell a security; and are not warranted to be correct, complete or accurate. Morningstar, its affiliates, and third-party content providers are not responsible for any investment decisions, damages or losses resulting from, or related to, the data and analyses or their use. To the extent any content is general advice, it has been prepared for clients of Morningstar Australasia Pty Ltd (ABN: 95 090 665 544, AFSL: 240892), without reference to your financial objectives, situation or needs. For more information refer to our Financial Services Guide. You should consider the advice in light of these matters and if applicable, the relevant Product Disclosure Statement before making any decision to invest. Past performance does not necessarily indicate a financial product’s future performance. To obtain advice tailored to your situation, contact a professional financial adviser. Articles are current as at date of publication.
This website contains information and opinions provided by third parties. Inclusion of this information does not necessarily represent Morningstar’s positions, strategies or opinions and should not be considered an endorsement by Morningstar.