Register For Our Mailing List

Register to receive our free weekly newsletter including editorials.

Home / 404

Buffett's favourite indicator versus all-in equities

"If you had read that article in 1979, you would have suffered - oh, how you would have suffered! - for about three years. I was no good then at forecasting the near-term movements of stock prices, and I'm no good now. I never have the faintest idea what the stock market is going to do in the next six months, or the next year, or the next two."

Warren Buffett, Fortune Magazine, December 2001

***

You're in good company if you don't have a clue what the stock market will do in the next year or two. The queue starts here.

In a recent Firstlinks editorial on asset allocation, we highlighted the risks in a traditional 60% growth/40% defensive portfolio, especially when most of the 40% is earning negligible returns in bonds. Several comments criticised the defensive allocation in a super portfolio required to build wealth for the long term.

Notably, we were contacted by well-known author and lecturer, Peter Thornhill of Motivated Money, who has consistently argued that investors should hold most of their retirement assets in industrial shares paying steady dividends, avoiding cash and term deposits (other than a three-year reserve to reduce the risk of selling shares in a down market). Peter wrote:

"Your article today is very timely. The super industry serves the public badly. Trying to protect them from short term volatility because of ignorance is an abrogation of their responsibility.

They should be educating the public to understand the monumental price they pay for this stupidity. Adding rubbish like cash, bonds and property is like adding lead to the saddlebags of a racehorse.

(Peter updated his chart showing 40 years of returns on industrial shares, listed property trusts and term deposits).

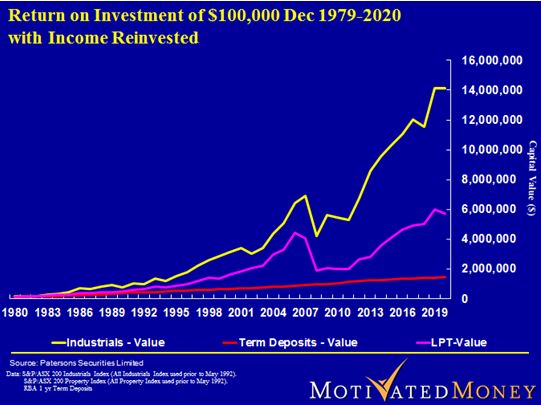
I left the industry in 2000 for this very reason. I have no qualifications and my role in the funds management industry was purely marketing.

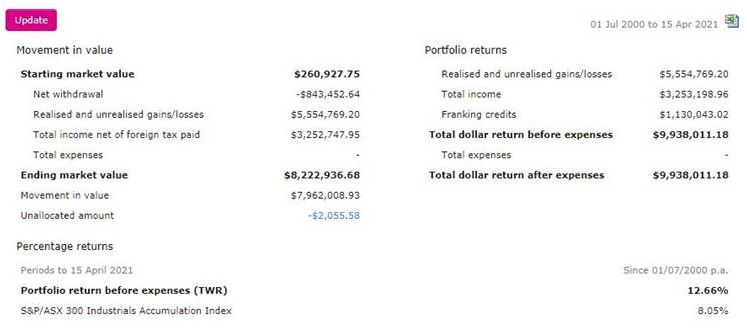
At that time, I started our self-managed super fund. Below is the result over the last 20 years. A combination of minimum cash, no resources, bonds or property, combined with my dumb luck, has served us well.

(Editor's note: Peter gave approval to share his personal spreadsheet. He says his calculation takes into account all contributions made and the performance of each addition from the entry date. TWR is Time Weighted Return. This article shows some of the stocks he owns).

Volatility is not a measure of risk; it is a measure of liquidity. In a super fund, time is on your side and short-term volatility is your friend. Buying CBA at $26 and Wesfarmers at $13, amongst many others, during the GFC was a godsend.

My other major concern is the brouhaha over fee levels. They pale into insignificance compared to the asset mix. The shortfall with the wrong assets over the lifespan of a super holding is monumental."

***

The obvious difficulty with Peter's 'all-in equities' strategy for most retirees is that they cannot tolerate the risk. Watching 90% of your portfolio fall 50% in a market crash when you plan to spend 20 years living on the capital and its income is too much for many to stomach. For peace of mind and a decent night's sleep, retirees accept low returns for low risk and capital protection.

But the cost of this conservatism has never been greater. When term deposits were paying 8%, it was an easier decision to protect capital, but now more investors are heading into riskier assets to generate decent returns.

So far it has paid off.

Unfortunately, nobody runs down the middle of the road waving a red flag the day before a market crash. Those who say they will simply sell before the fall are dreaming. What could trigger this amazing foresight? Anyone who sells after, say, a 5% fall based on the belief that 5% will turn into 50% is just as likely to miss the rebound and sit in cash while the market continues its run.

In the absence of a red flag, all we can do is look to history for a poor guide, recognising the current set of circumstances is unique. But apparently, if we don't learn from history, we are condemned to repeat it, so where better to start than with Warren Buffett.

Buffett's favourite market indicator

The ratio of the market value of the stock market to GDP has become known as the 'Buffett Indicator' after Buffett told Fortune Magazine that it is: “probably the best single measure of where valuations stand at any given moment.”

It has intuitive appeal, comparing the value of all companies in the Wilshire 5000 Total Market Index (the value of all stocks traded in the United States) with US quarterly GDP. Although it has been trending higher, the theory is that the value of companies should not grow at a faster pace than economic growth for a long time period.

On 15 April 2021, the ratio was an extraordinary 236%, which is not only higher than in the dot-com bubble, it's the highest it has ever been above its long-term trend. It is almost three standard deviations above 'fairly valued'.

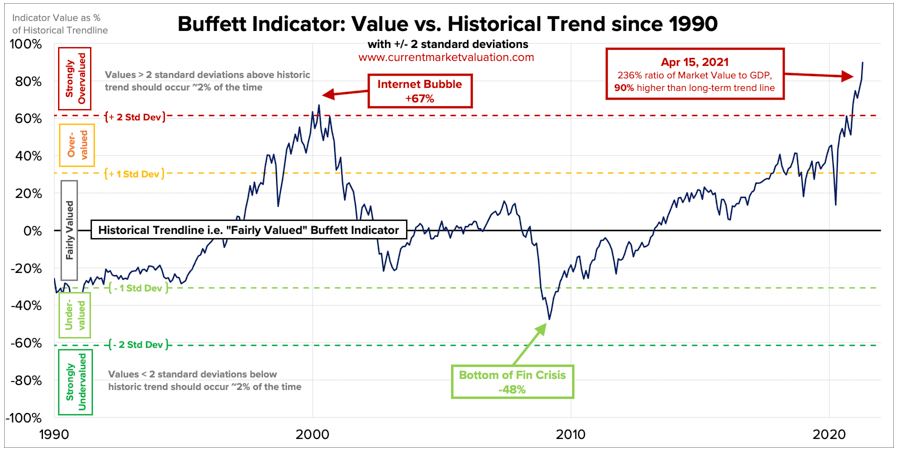
Source: Current Market Valuation (CMV)

Should we be worried?

According to Warren Buffett:

"For investors to gain wealth at a rate that exceeds the growth of US business, the percentage relationship line on the chart must keep going up and up. If GNP is going to grow 5% a year and you want market values to go up 10%, then you need to have the line go straight off the top of the chart. That won't happen.

For me, the message of that chart is this: If the percentage relationship falls to the 70% or 80% area, buying stocks is likely to work very well for you. If the ratio approaches 200% - as it did in 1999 and a part of 2000 - you are playing with fire."

Sounds like he never expected to see 236%!

The Buffett Indicator has predicted several historical moments in the US stock market, such as the dotcom bubble (index was 'strongly overvalued'), the bottom of the GFC (index was 'undervalued) and even COVID-19 in February 2020 (index was overvalued).

The big differences in 2021 are the historic low levels of interest rates and central bank willingness to do whatever is necessary to support recovery. Even Buffett concedes that stocks are not always better than bonds:

"But as Keynes would remind us, the superiority of stocks isn't inevitable. They own the advantage only when certain conditions prevail."

And one of those conditions is the entry point, which should not be at an expensive market extreme.

How much buying support remains?

There is an infinite array of charts that can prove anything, but let's take one from John Mauldin's newsletter, Thoughts from the Frontline, where he states:

"Right now, the stock market is in the land-where-there-should-be-sea phase. What we don’t know is when the wave is coming. Maybe there’s time to venture out and see what treasure was hidden beneath the waves ... or maybe not. Prudence would suggest that we go searching for treasure on higher ground."

The chart from Rosenberg Research shows the significant amount that US investors have poured into the stock market since the bottom of the pandemic cycle. Mauldin says the investments in equities have already added fuel to the fire and he questions where future buyers will come from.

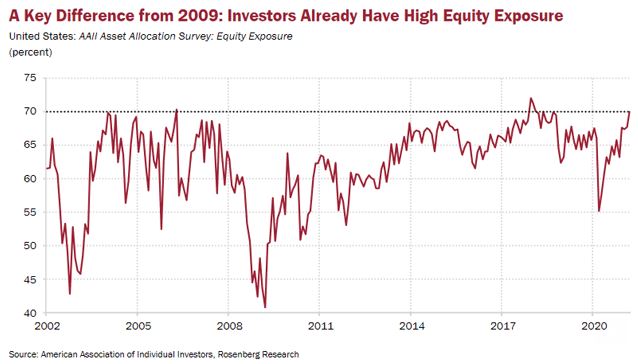
This fuel has driven the rapid recovery in share prices, far greater than the rise from the lows in recessions such as 1990, 2002 and 2009. The implication is the gains have already been made.

Australian confidence

The latest Westpac-Melbourne Institute Consumer Confidence Index in April 2021 shows a rise from March’s 111.8 to 118.8. Said Westpac Chief Economist Bill Evans:

“This is an extraordinary result. The Index is now at its highest level since August 2010 when Australia’s post-GFC rebound and mining boom were in full swing.”

An Index above 100 indicates the number of consumers who are optimistic is greater than the number of pessimistic consumers, with the long-term average of 101.

Also, NAB’s latest monthly business survey index of over 400 firms registered 25, a record high, and a significant improvement on February's 17. ANZ Senior Economist Catherine Birch said:

“The March NAB business survey confirms our expectations that the impact of the end of JobKeeper on the economic recovery will be short and limited and gives us more confidence in a strengthening business investment outlook.”

Both of which lay the groundwork for economic growth and business profits. However, the one-year forward price/earnings ratio of the Australian market is 19 times, or about 30% over the long-term trend, leaving little margin of safety.

The final words

While share prices are high based on historical metrics, lenders and central banks are delivering plenty of liquidity and stimulus. The pandemic has loosened the purse strings like never before in history, and banks are not inclined to seize assets as they have in previous cycles.

Let's finish with another Warren Buffett statement from his most recent annual shareholder letter, with a simple focus on long-term investing that support's Peter Thornhill's general strategy:

"All that’s required is the passage of time, an inner calm, ample diversification and a minimisation of transactions and fees."


Graham Hand is Managing Editor of Firstlinks. This article is general information and does not consider the circumstances of any investor.


18 Comments
Randall
April 22, 2021

Similar to others here, since about 2004/5 when Peter talked about 'benign neglect' and trying to find the 87 crash in his graphs at a Australian Shareholders conference, I too have trended to be heavily into LICs with reasonable dividend outcomes across now the GFC and Covid times. Pre GFC I did follow my then financial advisors advice to go into a few term deposits/hybrids and LPTs most/all ending in difficult places and learning the hard way. Since then I have been happy to accept the more reliable income streams from equities/LICs noting the potential that asset growth could be compromised and a need to sit tight when the inevitable asset price drop occurs. Waiting for the bottom is difficult but given we cannot predict the future, I remain one of those prepared to take the risk.

David Priest
April 22, 2021


Head over to Vanguard > https://insights.vanguard.com.au/VolatilityIndexChart/ui/retail.html to compare asset classes and diversified combinations for yourself.

Data from 1 January 1970 to 28 Feb 2021.


Dudley.
April 23, 2021

"to 28 Feb 2021":

At a share price peak. Try at a share price bottom; 2009, Jan. Or a growth trend line. Not so much difference between asset returns.

Alan B
April 22, 2021

Yes, you are in good company if you don't have a clue what the stock market will do in the next year or two.
Here is what the experts said about AGL in 2018:

"Top broker Goldman Sachs also rate AGL as a ‘buy’ given their forecast of a rebound in the wholesale electricity forward curve.This energy company’s shares provide a trailing fully franked 3.7% dividend at the current share price. This is expected to grow strongly over the next couple of year according to a recent note out of Goldman Sachs. Its analysts believe that the combination of its increased payout ratio and strong growth in earnings will lead to its dividend growing at an average of 17% per annum for the next three years. In light of this, the broker has a buy rating on its shares and a price target of $31.10."

Well, from April 2019 to 23 April 2021 the AGL price fell by 60% to $8.74 and its dividend has also been dropping.

mpang98z
April 25, 2021

buyer beware. read brokers' recommendation with a pinch of salt.

Kevin
April 22, 2021

I'm in the long term buy and hold camp too.The compounding is amazing.Mine is mainly the banks for decades.The dividends now after using DRP plans for decades are very high and produce an excellent income.Throw in Wesfarmers held for around 22 years now and things are great.

For some reason people seem to have great difficulty doing nothing at all,just leave things alone to grow.

The volatility is a price to pay.I have always thought the very small number of shares that change hands every day are taken too seriously..Have a look at prices once or twice a year.
The crashes can be gut wrenching,but in March 2009 who'd have thought we would be basically back where we were 5 or 6 months later.The same last March,who thought it would bounce back so quickly.The money made from the NAB rights issue,I think around $15 a share if I remember correctly,took my full entitlement.$15 or so up to $26 in such a short time.

The same for WES in 2008/9.I got the first lot at around $28,and was spent up and couldn't buy any in the second lot at around $14.50.Add the COL and WES share price together and they are around $72 now .

Indicators are not really a pointer as we cannot predict the future,do we put too much faith in them?.Get 100 predictions wrong and nobody remembers,get 1 right and be held in awe for the rest of your life .

David E
April 21, 2021

I also came across Peter Thornhill many years ago. I loved what he spoke about and have been a big Aussie shares fan ever since. The ASX will fund my future retirement.

Warren Bird
April 21, 2021

Hah! Bonds and property are not 'rubbish', Peter Thornhill. They may not be appropriate assets to include in super (though that's at least debatable), but they are perfectly valid asset classes for many investors. It all depends on the liability profile of the investor. Mostly I have in mind institutions like insurance companies who need to plan for their investments to mature with a clear capital value at certain future dates, who simply have to hold bonds to achieve that outcome. But also, individuals who have a whole range of shorter term investment needs than just their retirement find that assets like bonds that mature with a known value in the future are very good assets to hold.

Holding one or two properties for rental income instead of a portfolio that's either equity oriented or includes a good chunk of equities is poor asset allocation under any circumstances in my book, but again property is a perfectly valid asset class that doesn't deserve to be called rubbish.

Ben
April 21, 2021

The obvious problem with the "Buffet Indicator" is that it fails to take into account the proportion of "American" companies that own portions of other country's GDP rather than the USA's GDP, nor of companies listed on American exchanges that aren't meaningfully "American" (Atlassian, anyone?).

One presumes that this would have grown quite considerably since 2001.

Graham Hand
April 21, 2021

Fair point, Ben. Taking a liberty speaking for my mate Warren, it works the other way as well with companies operating in the US listed on foreign exchanges. We are talking about over US$50 trillion market cap, Atlassian is a US$50 billion company, so it is only 1/1,000 of the US market cap so it doesn't touch the sides. The US is a domestic consumer economy (accounting for 70% of economic activity) rather than a overseas trading economy.

Ben
April 22, 2021

Are there any notable examples where someone has done the nitty gritty work to estimate the American economy-only components of US market capitalisation to then compare against GDP?
For example ascribing some % of Amazon's/Facebook's/Alphabet's etc market cap based on earnings from the US alone?

Ben
April 27, 2021

Yeah, all fair points too.

I imagine, though, that if you compared the % of S&P earnings that were domestically sourced in 2001 vs the % of S&P earnings that are domestically sourced now, the numbers would be vastly different. The world has got a lot more global since then.....

I mean just look at the 10 biggest US stocks: Apple, Google, Microsoft, Amazon, Facebook, Berkshire, Johnson & Johnson, Proctor and Gamble, and Visa. They are all global companies. Berkshire itself, ironically, is seemingly one of the more domestically focused companies of those.

I'm sure someone out there has done the numbers, but I have never seen them!

PS - someone posted on here as Ben.. different guy...

Graham Hand
April 21, 2021

We had an email asking about the numbers behind this 236% calculation, so they are:
Aggregate US Market Value: $51.8T
Current Quarter Annualized GDP (Estimate): $21.9T
Buffett Indicator: $51.8T ÷ $21.9T = 236%

Gary M
April 21, 2021

I would love to lock away my share and equity fund portfolio for 20 years and I'm sure it would do well, but try as I might, I can't help but check how much it is worth, especially when it falls.

Russell Wadey
April 25, 2021

Gary, you could try calculating and using the dividend (or earnings) yield on your shares when there is a market price change, as your measure of what they are "worth", instead of their market price. Should give you comfort when prices fall.

Mart
April 21, 2021

"All that’s required is the passage of time, an inner calm, ample diversification and a minimisation of transactions and fees." .... spend less than you earn, productively use the remainder, and do this consistently (and boringly !) over a long period of time. The asset allocation matters as discussed, but anyone doing this will do OK if they allocate soundly (regardless of the asset they pick)

Ken Perry ACA KP
April 21, 2021

I ran into Peter Thornhill when he talked about investing while working for MLC and I have not run into him since. After his talk with about 40 odd people because of some of the questions I asked he invited me to have a chat with him. He obviously has not changed his beliefs from then (which must be 30 odd years or so ago). I have stuck with what he said to me with some small variations after starting a smsf in 1997. He said to me this is only general advice and other things had to be considered. I have held a portfolio with 80% industrials ever since I started our smsf (sorry peter). To our joy we have retired very comfortably. I started in the market in 1963 with a small resources stock which cost me 10 quid, 2 1/2 weeks pay. I then followed my thoughts on paper for 6 years with a very small buy occasionally. That loss in 1963 (2.5 weeks pay) was one of the best lessons I ever learnt. Something I have never forgotten from our conversation was you have to learn to separate the chaff from the straw (what is real and what is waffle) when reading articles about investments, and that only comes from years of experience.

Kevin W
May 05, 2021

30 years ago I used to listen to Bruce Bond on ABC Saturday morning Radio. He used to tell people what to buy and back it up with "I know my sharemarket". Just like Bruce Bond the experience that you and I both now have has taught us an encyclopaedia full of sharemarket knowledge and the mistakes we have made have been our tuition fee. There's nothing like owning shares in a company to accelerate learning about the "business" you have bought into. This brings me to the golden rule that I try to impart on everyone who asks me about buying shares.
You are buying a share in a business and if it doesn't produce anything or make a profit, it's not much of a business.


Leave a Comment:

RELATED ARTICLES

Dump the short-term churn for better long-term performance

The ASX's 16-year drought: a rebuttal

Even Warren Buffett lost his edge 20 years ago

banner

Most viewed in recent weeks

2024/25 super thresholds – key changes and implications

The ATO has released all the superannuation rates and thresholds that will apply from 1 July 2024. Here's what’s changing and what’s not, and some key considerations and opportunities in the lead up to 30 June and beyond.

The greatest investor you’ve never heard of

Jim Simons has achieved breathtaking returns of 62% p.a. over 33 years, a track record like no other, yet he remains little known to the public. Here’s how he’s done it, and the lessons that can be applied to our own investing.

Five months on from cancer diagnosis

Life has radically shifted with my brain cancer, and I don’t know if it will ever be the same again. After decades of writing and a dozen years with Firstlinks, I still want to contribute, but exactly how and when I do that is unclear.

Is Australia ready for its population growth over the next decade?

Australia will have 3.7 million more people in a decade's time, though the growth won't be evenly distributed. Over 85s will see the fastest growth, while the number of younger people will barely rise. 

Welcome to Firstlinks Edition 552 with weekend update

Being rich is having a high-paying job and accumulating fancy houses and cars, while being wealthy is owning assets that provide passive income, as well as freedom and flexibility. Knowing the difference can reframe your life.

  • 21 March 2024

Why LICs may be close to bottoming

Investor disgust, consolidation, de-listings, price discounts, activist investors entering - it’s what typically happens at business cycle troughs, and it’s happening to LICs now. That may present a potential opportunity.

Latest Updates

Shares

20 US stocks to buy and hold forever

Recently, I compiled a list of ASX stocks that you could buy and hold forever. Here’s a follow-up list of US stocks that you could own indefinitely, including well-known names like Microsoft, as well as lesser-known gems.

The public servants demanding $3m super tax exemption

The $3 million super tax will capture retired, and soon to retire, public servants and politicians who are members of defined benefit superannuation schemes. Lobbying efforts for exemptions to the tax are intensifying.

Property

Baby Boomer housing needs

Baby boomers will account for a third of population growth between 2024 and 2029, making this generation the biggest age-related growth sector over this period. They will shape the housing market with their unique preferences.

SMSF strategies

Meg on SMSFs: When the first member of a couple dies

The surviving spouse has a lot to think about when a member of an SMSF dies. While it pays to understand the options quickly, often they’re best served by moving a little more slowly before making final decisions.

Shares

Small caps are compelling but not for the reasons you might think...

Your author prematurely advocated investing in small caps almost 12 months ago. Since then, the investment landscape has changed, and there are even more reasons to believe small caps are likely to outperform going forward.

Taxation

The mixed fortunes of tax reform in Australia, part 2

Since Federation, reforms to our tax system have proven difficult. Yet they're too important to leave in the too-hard basket, and here's a look at the key ingredients that make a tax reform exercise work, or not.

Investment strategies

8 ways that AI will impact how we invest

AI is affecting ever expanding fields of human activity, and the way we invest is no exception. Here's how investors, advisors and investment managers can better prepare to manage the opportunities and risks that come with AI.

Sponsors

Alliances

© 2024 Morningstar, Inc. All rights reserved.

Disclaimer
The data, research and opinions provided here are for information purposes; are not an offer to buy or sell a security; and are not warranted to be correct, complete or accurate. Morningstar, its affiliates, and third-party content providers are not responsible for any investment decisions, damages or losses resulting from, or related to, the data and analyses or their use. To the extent any content is general advice, it has been prepared for clients of Morningstar Australasia Pty Ltd (ABN: 95 090 665 544, AFSL: 240892), without reference to your financial objectives, situation or needs. For more information refer to our Financial Services Guide. You should consider the advice in light of these matters and if applicable, the relevant Product Disclosure Statement before making any decision to invest. Past performance does not necessarily indicate a financial product’s future performance. To obtain advice tailored to your situation, contact a professional financial adviser. Articles are current as at date of publication.
This website contains information and opinions provided by third parties. Inclusion of this information does not necessarily represent Morningstar’s positions, strategies or opinions and should not be considered an endorsement by Morningstar.