Register For Our Mailing List

Register to receive our free weekly newsletter including editorials.

Home / 156

Fear factor should start the hunting season

As he sighed wistfully he thought, “It seems like only yesterday, but here’s another GFC so soon. Will it be the same as the last or different?”

I can say, with considerable conviction, that the next one won’t be different. The drivers are the same: moral hazard ramped up by thoughtless governments and fear. Fear is based on ignorance. Knowledge is power.

One would have thought that with the GFC still fresh in people’s minds we would not be reacting in the same way. It never ceases to amaze me that this sort of thing happens again and again yet still we never learn. To paraphrase George Santayana: “If we don’t learn from the past we are doomed to repeat it.”

Stock markets reflect human endeavour

Below is the pattern of stock movements and dividends paid superimposed on a term deposit and the subsequent interest payments over the last 35 years.

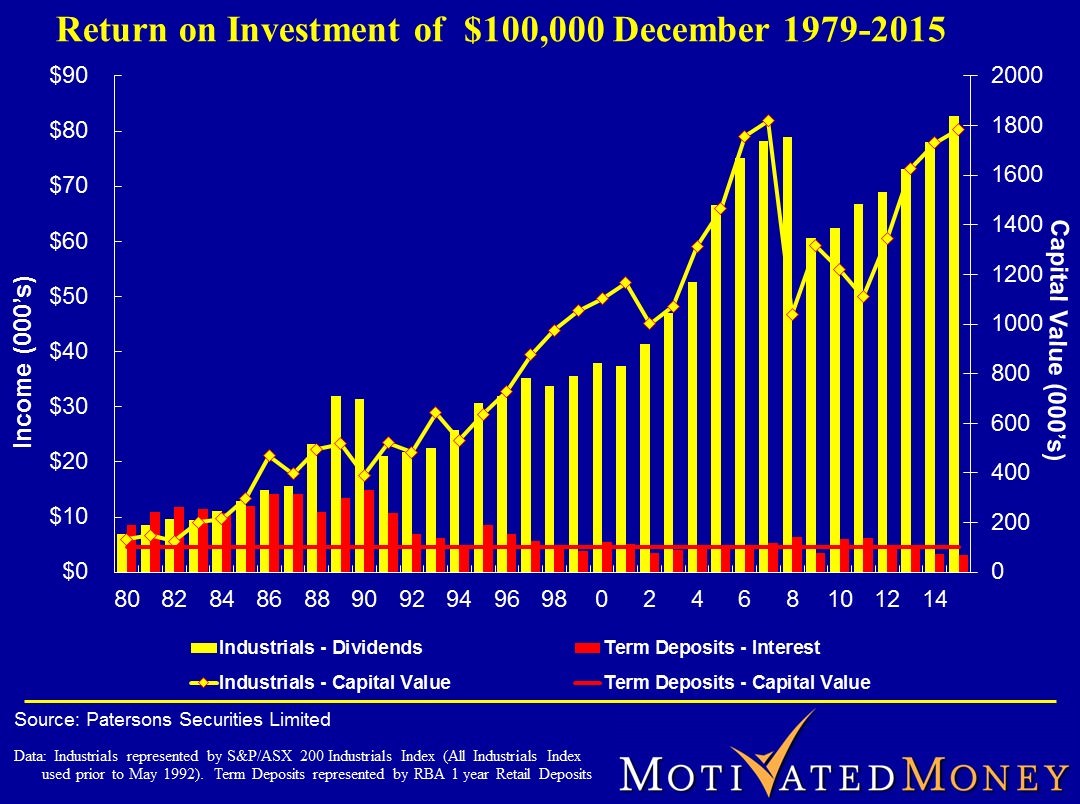
The GFC saw a drop of 50% in share prices, similar to the market correction of 1987. Although the GFC looks more substantial, it is only because the same drop of 50% was applied to an index that had grown steadily over the intervening 21 years since 1987.

Throughout all this, $100,000 invested in Australian industrial companies in 1980 now generates an income of about $80,000 a year and has a capital value of about $1.8 million. A term deposit is still worth $100,000 and delivers income of about $3,000 a year.

At the time of the GFC and during the seven years since, I have reminded audiences that we would recover from the GFC as we have from all previous falls throughout history. This would then be followed by another correction as greed, stupidity, speculative activity and misguided government intervention once again drove the prices up.

My rationale is that the stock markets of the world ultimately reflect the profitable endeavours of the human race (the unprofitable endeavours inevitably fail). For markets to collapse totally requires that all human endeavour comes to an end and I find this rather hard to imagine. However, I am surprised at the speed with which we have forgotten or, perhaps, never learned this lesson.

I will admit to one aspect of current conditions that we haven’t experienced for some time is low interest rates. It has been roughly 5000 years since we have had rates at the present levels! This is courtesy of misguided governments who, wishing to appear in control, have driven them down in an attempt to improve balance sheets resulting from our appalling financial behaviour. They are incapable of allowing us to suffer the consequences and this has led to the rise in moral hazard over recent decades.

Headlines ignore strength of company balance sheets

Here in Australia company balance sheets are generally in much better shape than they were prior to the GFC and it is clear that fear not fundamentals are driving the present gyrations. If I may quote a few headlines from recent media:

Market bounces back but fears China will drag down the world

Fear indexes surge to highest since GFC as China slide spooks markets

The day began with investors fearing the worst as the market fell to a fresh two-year low of 4929 in early trade.

Fear driving sideshow but no need to panic here

$A drops to six-year low as ‘fear takes over’ in global markets

Chinese fears spark region-wide rout

And so it goes on, ad nauseam!

Check the preponderance of comments relating to China amongst the above. I guess it makes a change from the ‘European crisis’ or ‘Middle Eastern crisis. Recently, an article in The Australian newspaper titled ‘Stock shock leaves a trail of victims’ caught my eye. The example given was a white collar worker in Beijing who had sold his house in March 2015 to INVEST (my emphasis) in the Chinese equities market.

Predictably, he has seen his ‘fortune’ eliminated in a few months. He told the journalist that he knew the risks when he joined with friends to invest nearly 2 million yuan in the volatile market but was still angry with the consequences. He is now worried that his decision to invest in equities could have long-lasting consequences. “I am old enough to get married and you know here that girls prefer guys who own their own houses,” he said. “I didn’t tell my Mum that I sold the house; she would be too mad.”

What right did this lunatic have to feel angry I ask myself? I feel angry with the journalist who included the word ‘invest’ in the article to describe the stupid speculation that this young man indulged in.

The saddest footnote to all this pathetic reporting was an article titled: “Global market rout means surge in fear indexes.” With a sharp correction on Wall Street earlier in the week the US ‘fear index’, otherwise known as the Chicago Board Volatility Index, surged as much as 90% to levels not seen since the height of the GFC. Fear has now become a tradeable commodity.

It’s irrelevant for investing

None of it has anything to do with investors or investing. I suggest that the only appropriate action taken by investors should be to top up or add holdings to their portfolio. I am on record, when asked in an interview after the GFC, what was on my wish list for coming weeks, I responded with, “Another GFC please”. The interviewer was clearly nonplussed and asked why. My response was, “I would like to buy some more CBA at $26.00 and more Wesfarmers at $13.50!”

As this irrational process of rise and fall continues I ask people to heed the words of that famous Australian philosopher, Chopper Read, and “Toughen up, princess”. As the human race appears incapable of recalling the past, consider again the chart above and merely be prepared to take advantage of the ‘fear factor’, step up to the mark, lock and load and wait ‘til you see the whites of their eyes.


Peter Thornhill is a financial commentator, public speaker and Principal of Motivated Money. This article is general in nature only and formal financial advice should be sought before acting in any of the areas discussed. Cuffelinks attended the Australian Shareholders Association conference in Sydney this week at which Peter presented some of these views.


26 Comments
Phil Brady
May 26, 2016

Catcafe: But the dividends did drop - look at the chart. And even say Argo the biggest and most popular had a dividend drop. And the reason they can pay smoother dividends, better than when the market income falls as per the chart, is guess what? They hold cash as well to smooth the income, raise capital, etc etc. I'm not saying they are not good, just don't be blind to one very narrow chart that paints rosiness.

Gordon A
May 29, 2016

Draw a line from the dividend bar at the start of the chart to same at the end of the chart. You will notice it is closer to a straight line than not. Peter has said in the past that whether it's price or dividends where extraordinary events (eg intro of div imputation or irrational exuberance) cause it to vary to extremes there will typically be reversion to the mean. So rather than seeing the drop in dividends come the GFC an unexpected event I saw it as a return to normality.

Fortunately like Peter many of us who follow this approach have a generous core of older LICs. So even if some of us investors are blind to dividend outliers the LICs generally are not. Hence why they keep reserves to try to smooth dividends during tough times. They did such a good job that between them and our other Industrial holdings I can't say that our income was excessively impacted during the GFC.

It should be noted that I'm very much just an amateur investor. But thanks to the likes of Peter Thornhill I'm very comfortable knowing that whatever volatility comes along the dividends are significantly less so. Add in a cash buffer and I sleep very well at night. In fact the outcome from Peter's approach has been so successful that to date we are yet to draw on this cash buffer!

Jack
May 26, 2016

It is important to distinguish between volatility of prices and volatility of dividends (income). In the GFC the ASX dropped by almost 50%, average dividends fell by 22%, CBA dividends fell by 14% and other continuing going up. If volatility equals risk, then dividends are far less riskier than depending on share prices for capital gains.

It is not smart to be totally invested in one company. It is smart to hold a safety buffer of cash so that shares do not have to be liquidated into a falling market if the dividend income is insufficient. That is particularly true in superannuation pensions where minimum cash withdrawals are mandated.

I have been following Peter's strategy for years, including through the GFC, and it works! Tax-free super after 60 helps, as do imputation credits, but they are not required to make the strategy work.

Phil Brady
May 26, 2016

I agree with the diversification and the allocation to cash Jack, that's sort of my point, that that is not captured in the chart and discussion and therefore gives people false expectation around what the sharemarket can do without other planning. But the question is how much to cash? The answer to that will have an effect on the capital account and the rosy looking chart above and the time period you start investing. Because if you have use cash to bolster income, that cash reserve also has to be replenished, normally by drawing more capital if you are conservative and market dividends stayed low for a year or more.

Gordon A
May 29, 2016

Yes the chart does paint an attractive picture but that doesn't mean the outcome is a lie. Of course other time periods could result in a different outcome. In fact the chart would have looked even rosier if Franking Credits were included. And it is not just retirees reading Peter's articles but younger wealth accumulators as well.

This short article is not meant to be the equivalent of an entire financial plan by Peter. Anyone who follows him knows that he advocates a cash buffer to provide some protection against sequencing risk and a reduction in dividends for whatever reason.

I think most readers are intelligent enough to realise that there are any number of things that could impact the result (good or bad) other than just the time period used such as tax, franking and asset location eg Super, own name or Family Trust.

The simple but powerful message behind it is that of investing in a superior asset (Industrial Shares) with strong income growth over a long period of time which reduces the likelihood of having to draw down on capital.

And Peter's comment in relation to dividend reinvestment shows just what a powerful strategy this would be for younger investors. Do this in Super over a long period of time where half the franking credits pay the tax and the other half is available for reinvestment then I think in terms of outcome the word "attractive" definitely comes to mind.

Finally as a follower of Peter's approach over a long time period and knowing more than the odd one or two others doing the same (or as a major part of their strategy) I can say that rather than being disappointed with the outcome in all cases we have been astounded with the result!

Justin
May 24, 2016

Peter, does that mean that you don't use LIC's that have some resource company exposure?

Phil Brady
May 26, 2016

Yes agree, but the capital is effected by the sequence because of the cash flows, not exclusive to them. If you front end load the negative returns, using say Calendar year 2008, - 44%. Then the capital of $1M drops to 556K. 4% income say of $1M to survive =40K. 4% yield from the market per chart in second year = $22K. Therefore the investor must take additional capital, therefore this effects the comparison. Peter's example assumes everyone can just live on the 4% average market yield irrespective of the $$ figure this spits out. That's why I think it still sets unrealistic expectations. The chart itself shows income falling from 80K to 45K in 2008 with no effective reduction in capital to compensate for income. Its just not real world. Peter's personal example may be true, but only because he did not suffer significant negative returns initially, or had other capital stored, or other income streams to rely on.

CatCafe
May 26, 2016

If the capital value drops and the dividends are maintained (which is what happened in the case of LICs), then the new dividend yield becomes ~7.2%.

Peter Thornhill
May 31, 2016

Justin, I use 4 old LIC's. Three have some exposure to the top dividend paying resources but our direct shareholdings dilute these; I'm not a 'perfectionist'. I make 2 simple cuts; minimal resources and as little property as we can manage.

Phil Brady
May 31, 2016

What's the strategy Peter when the LIC's trade at pretty decent premiums for long periods of time? How/what do you buy and when? Do you advocate just paying the premium given the long term?

Warren Bird
May 22, 2016

The comparison is meaningless. Term deposits are not meant to be used as a long term investment vehicle. If your time horizon is decades then you need an asset that has a duration of decades - shares and property fit this bill. Term deposits are suitable for investment time horizons that align with their short term nature.

So to say that an investment in shares in 1980 is now worth a lot more than term deposits is a massive straw man. It does not mean that TD's are an inferior investment only that they are inferior as a multi-decade investment. That's lesson 1 of Investment 1.01 isn't it?

Peter Thornhill
May 23, 2016

Easy to say Warren and I don't disagree. Too many people over the last 50 years of my time in the industry have tried to use term deposits as investments with the inevitable consequences.
Yes, it is '101' but how many people use common sense as a guide?

Phil Brady
May 24, 2016

I agree its a massive straw man, because it has a particular starting point and doesn't identify the portfolios cash flows. The lesson is fine but simplistic and possibly dangerous in terms of expectations set. If a flat or negative period of returns occurs at the start period of any investment where cash flows are being withdrawn, then the subsequent cumulative capital is not going to look anywhere near as attractive as on the chart.

Chris Eastaway
May 25, 2016

Peter has been fairly clear that in his example (and in his subsequent comments) the dividends and interest income are NOT reinvested. So If a flat or negative period of returns occurs at the start period of this investment, where cash flows are being withdrawn in full each year, then the subsequent capital is going to look exactly as attractive as on the chart - because it's not cumulative.

John Tonkin
May 21, 2016

For further explanation, I suggest you read Peter's book.

Peter Thornhill
May 21, 2016

Jack, I am comparing on a like for like basis. In both cases all income is spent. If interest and dividends are reinvested the deposit comes in at around $1.3 mill and the industrials value would be just over $10mill.
Also, the benefit of franking is ignored.

Jack
May 21, 2016

Correct me if I'm wrong Peter, your statement

"Throughout all this, $100,000 invested in Australian industrial companies in 1980 now generates an income of about $80,000 a year and has a capital value of about $1.8 million. A term deposit is still worth $100,000 and delivers income of about $3,000 a year."

This is assuming:
1) Interest collected from term deposit is not reinvested
2) Income from shares are reinvested and total return includes franking credit

This does not put the 2 investments in a level playing field, what will the outcome be if the interest from the term deposit is reinvested ?

Peter Thornhill
May 21, 2016

There is one listed investment company I use that has only industrials unlike all the other larger, older LIC's.
Whitefield. Been around since 1923 and holds roughly 140 industrial companies.

Peter Thornhill
May 21, 2016

Chris, it makes a big difference as to which index you use. The difference between the resources and industrial sector is huge. Mainly as a result of the larger and consistent dividend stream.

Peter Thornhill
May 21, 2016

Ashley, The 200 GICS Industrial index does have 26, as you say - but it's not that index we use. It is the ASX 200 minus the resource exposure, about 30 stocks, so it is 130 give or take.

Phil Brady
May 20, 2016

It would be great to see a chart where the sequence return effect for a pension client taking income effected the wealth/income outcome portrayed above.

Peter Thornhill
May 21, 2016

Phil, We are the living experiment. Having already converted to pension phase we have been relying on our SMSF for income from the equities held in the fund. Works a treat, even during the GFC. We have been withdrawing slightly more than the mandated minimum so are not relying on capital.
It is the capital drawdown for most people that is the killer. Get in touch and we can discuss it further if you wish.

Ashley Owen
May 19, 2016

Chart refers to S&P/ASX 200 Industrials Index. Almost nobody invests in that index. It looks like there are 200 industrial stocks in this index but there are only 26 and they only comprise less than 2% of the market ($25b out of 1.5trillion). The index is mainly banks and miners. (Very unlike the US where the DJIA is a pretty good proxy for the US market – and includes much more than ‘industrials’ - including banks and resources stocks.

Graeme
May 19, 2016

Ashley,

I can't find a complete list of the companies that make up the ASX 200 Industrials, but the ASX Sector Index Overviews indicate that it does NOT include banks and miners, there being separate ASX 200 Bank and ASX 200 Materials indexes for these. It does, however, have a good spread of industries and is probably a better representation for the future than the bank heavy general indexes.

I am also not sure how you derived the 2% figure. The ASX 200 Industrials does indeed have 26 stocks, but as at 29/4/16 the mean market cap was $4.8b giving a total of $125b or about 8% of the ASX.

Chris Eastaway
May 20, 2016

For the point of this article does it really matter if you take the ASX 200, the ASX 200 Industrials Index or the All Ords as your benchmark?

I imagine you can pick any index you like as long as the underlying companies fit the criteria of both “profitable” and “dividend paying”, and achieve a similar result if the comparison to be made is against traditionally high(er) yielding but no growth asset classes such as term deposits.

Peter can correct me if he so wishes, but is it not the point of the piece to shine a light on the benefits of holding profitable, dividend paying company shares over the very long term as opposed to term deposits (or any other traditionally labelled “yield” assets for that matter), regardless of the general level of market pessimism we might digest on a daily basis? I think this is time honoured common sense (although I might be too optimistic assuming it’s “common”?)

It’s worth noting however that I can find no simple way to invest in the Industrials Index? I can identify the weighting within the ASX 200 Index of 24 of the 26 companies that make up the Industrials Index, and could feasibly directly manage my own exposure, but that’s far too laborious for me. So as a proxy I’ll stick to a few of the larger, older, low cost LIC’s (which include banks and miners) and hope for similar results over time.

Peter Thornhill
May 23, 2016

Ashley, the comment below comes from someone with a deeper knowledge than mine.

The GICs Industrials sector includes only stocks in “Industry” sector – largely manufacturing, and would include only around 20-odd stocks out of the full ASX200. It does not include either banks or miners. The Global Industry Classification System is a tiered system which allocates stocks into one of 10 sectors, 24 industry groups, 57 industries and 156 sub-industries.

The ASX200 Industrials uses the term “industrials” in a broad sense to refer to all enterprises other than resource producers . The ASX200 Industrials has roughly 170 stocks out of the ASX200, making up currently approximately 90% of the ASX200 market capitalisation, and includes banks, but does not include miners. This broad industrials/resources distinction represents the primary dissection through which the All Ordinaries and ASX200 have been split over many decades into two main categories All Resources/All Industrials and ASX200 Resources / ASX200 Industrials.


Leave a Comment:

RELATED ARTICLES

Underperformance from investing at the wrong time

banner

Most viewed in recent weeks

2024/25 super thresholds – key changes and implications

The ATO has released all the superannuation rates and thresholds that will apply from 1 July 2024. Here's what’s changing and what’s not, and some key considerations and opportunities in the lead up to 30 June and beyond.

The greatest investor you’ve never heard of

Jim Simons has achieved breathtaking returns of 62% p.a. over 33 years, a track record like no other, yet he remains little known to the public. Here’s how he’s done it, and the lessons that can be applied to our own investing.

Five months on from cancer diagnosis

Life has radically shifted with my brain cancer, and I don’t know if it will ever be the same again. After decades of writing and a dozen years with Firstlinks, I still want to contribute, but exactly how and when I do that is unclear.

Is Australia ready for its population growth over the next decade?

Australia will have 3.7 million more people in a decade's time, though the growth won't be evenly distributed. Over 85s will see the fastest growth, while the number of younger people will barely rise. 

Welcome to Firstlinks Edition 552 with weekend update

Being rich is having a high-paying job and accumulating fancy houses and cars, while being wealthy is owning assets that provide passive income, as well as freedom and flexibility. Knowing the difference can reframe your life.

  • 21 March 2024

Why LICs may be close to bottoming

Investor disgust, consolidation, de-listings, price discounts, activist investors entering - it’s what typically happens at business cycle troughs, and it’s happening to LICs now. That may present a potential opportunity.

Latest Updates

Shares

20 US stocks to buy and hold forever

Recently, I compiled a list of ASX stocks that you could buy and hold forever. Here’s a follow-up list of US stocks that you could own indefinitely, including well-known names like Microsoft, as well as lesser-known gems.

The public servants demanding $3m super tax exemption

The $3 million super tax will capture retired, and soon to retire, public servants and politicians who are members of defined benefit superannuation schemes. Lobbying efforts for exemptions to the tax are intensifying.

Property

Baby Boomer housing needs

Baby boomers will account for a third of population growth between 2024 and 2029, making this generation the biggest age-related growth sector over this period. They will shape the housing market with their unique preferences.

SMSF strategies

Meg on SMSFs: When the first member of a couple dies

The surviving spouse has a lot to think about when a member of an SMSF dies. While it pays to understand the options quickly, often they’re best served by moving a little more slowly before making final decisions.

Shares

Small caps are compelling but not for the reasons you might think...

Your author prematurely advocated investing in small caps almost 12 months ago. Since then, the investment landscape has changed, and there are even more reasons to believe small caps are likely to outperform going forward.

Taxation

The mixed fortunes of tax reform in Australia, part 2

Since Federation, reforms to our tax system have proven difficult. Yet they're too important to leave in the too-hard basket, and here's a look at the key ingredients that make a tax reform exercise work, or not.

Investment strategies

8 ways that AI will impact how we invest

AI is affecting ever expanding fields of human activity, and the way we invest is no exception. Here's how investors, advisors and investment managers can better prepare to manage the opportunities and risks that come with AI.

Sponsors

Alliances

© 2024 Morningstar, Inc. All rights reserved.

Disclaimer
The data, research and opinions provided here are for information purposes; are not an offer to buy or sell a security; and are not warranted to be correct, complete or accurate. Morningstar, its affiliates, and third-party content providers are not responsible for any investment decisions, damages or losses resulting from, or related to, the data and analyses or their use. To the extent any content is general advice, it has been prepared for clients of Morningstar Australasia Pty Ltd (ABN: 95 090 665 544, AFSL: 240892), without reference to your financial objectives, situation or needs. For more information refer to our Financial Services Guide. You should consider the advice in light of these matters and if applicable, the relevant Product Disclosure Statement before making any decision to invest. Past performance does not necessarily indicate a financial product’s future performance. To obtain advice tailored to your situation, contact a professional financial adviser. Articles are current as at date of publication.
This website contains information and opinions provided by third parties. Inclusion of this information does not necessarily represent Morningstar’s positions, strategies or opinions and should not be considered an endorsement by Morningstar.