Large super funds have been waiting anxiously for the release of the regulator’s ‘heatmap’, which assesses the performance of every MySuper product. While many trustees will be relieved by the good results, others will be worried and are likely to face pressure from APRA to perform or merge. The heatmap identifies 416 funds on this link.
The Excel spreadsheet looks unwieldy at first, but it includes a 'User Guide' tab and an explanation of the colours. Funds with dark red or orange for performance or fees will face more scrutiny, and white is good.
MySuper funds are supposed to be simple and low cost, and are the only funds which can accept default contributions. They are usually balanced portfolios with a growth emphasis, and hold about $800 billion of the $3 trillion in super.
APRA defines the objectives and use of its heatmap as:
“The objective of the Heatmap is to provide credible, clear and comparable insights into the outcomes provided by MySuper products in a number of key areas. The Heatmap is expected to drive improvements in outcomes for members by holding RSE licensees publicly accountable for their performance, and in particular highlighting areas of underperformance.”
APRA Deputy Chair Helen Rowell said on the release of the report:
“Australia’s superannuation system delivers sound outcomes for most members, but APRA is determined to weed out the industry’s underperforming tail ... we directly contacted the trustees of the worst performing products and asked them to provide or update action plans outlining how they will address identified weaknesses. If they are unable to make substantial improvements in good time, we will consider other options, including pressuring them to consider a merger or exit the industry.
APRA identified four major insights from its research:
Key insight #1: significant variation of results
Although the funds were all MySuper compliant, a wide range of results were found. APRA focused on five-year performance as the longest time horizon available, although it should aim for at least 10 years. Performance over shorter periods can be affected by cyclical factors where funds with solid processes have not seen sound strategies pay off.
APRA differentiates between ‘single-strategy products’ with specific asset allocations, and ‘lifecycle products’ where the portfolio varies with the age of the member (eg, more into bonds as a member ages).
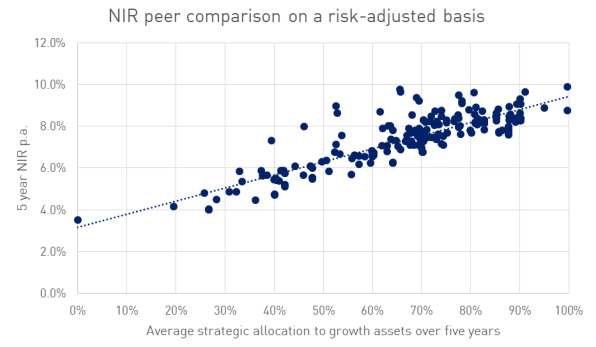
The five-year net returns on funds with over 60% allocated to growth assets ranged from 5.1% p.a. to 9.5% p.a. in single-strategy products (median 7.4%) and from 5.6% p.a. to 9.6% p.a. (median 7.9%) in lifecycle stages. Offered by many leading brands, 23 funds performed well below the industry average.
APRA makes the valid point that many other fund comparisons use a wide range of growth bands (such as 60% to 80%) in evaluating peer performance, which disadvantages funds at the lower end of the scale when markets are strong. Instead, APRA has taken the average allocation to growth assets and compared the funds with their five-year Net Investment Return (NIR), as plotted below. It shows that even allowing for risk, results vary significantly.
Key insight #2: underperformance in all industry segments and risk profiles
Underperformance was found in both single strategy and lifecycle stages with similar allocations to growth assets.
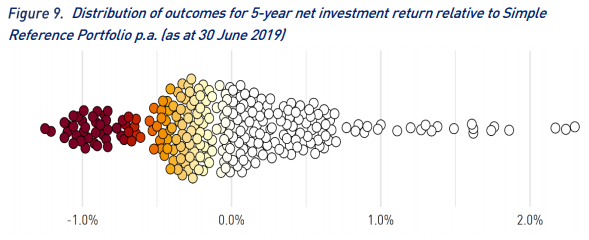
APRA built a Simple Reference Portfolio of passive, low-cost, liquid investments as a reference point. The figure below highlights underperforming funds and the level of underperformance. The colours are the same as used in the main heatmap, with dark red for poor results and white for acceptable (APRA deliberately avoids the endorsement implied by green).
Key insight #3: more single-strategy products outperformed than lifecycle products
APRA reports that of the 59 single-investment strategy products, 34 (or 58%) outperformed the Simple Reference Portfolio over the five years to 30 June 2019. However, of the 204 lifecycle stage products, only 74 lifecycle stages (or 36%) outperformed.
Following the introduction of MySuper, many retail funds rushed to lifecycle solutions, putting more money into defensive assets as a person ages. This has not paid off as equity markets have rallied strongly, and now, new bond investments are rolling into funds with rates less than 1.5% and long durations. We should expect many of the lifecycle strategies to be critically reviewed by APRA, trustees and members.
APRA has finally taken a stance on the definition of ‘defensive’ assets. Some super funds include infrastructure and property as defensive, where in reality, they have growth characteristics rather than the portfolio protection of government bonds. APRA has decided that listed infrastructure and property should be classified at 100% growth, while unlisted are 75% growth and 25% defensive.
Key insight #4: fee impact varies significantly based on account balance size
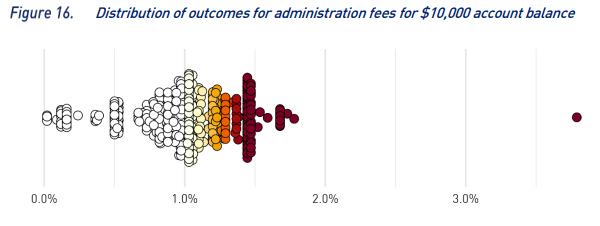
Figure 16 below shows the range of administration fees charged to MySuper products as a percentage of a $10,000 account balance. As a sign of the impact of expenses on low balances, 42% of funds have a fee in excess of 1%, with some over 1.5%. These are supposed to be low cost, simple options. Again, APRA uses the heatmap colours to show which fee levels are unacceptable.
Responses to the heatmap
No fund should only be judged by the colour in one category. Some of the more expensive funds are also the top performers. There are winners and losers among both the retail and the industry funds, and peak groups have advised fund members to consider a wider perspective.
The Financial Services Council jumped to defend retail funds, with CEO Sally Loane saying:
“The heatmap may tell you that other funds have had higher returns over five years, but if you’re close to retirement you might be far more concerned with how your fund is managing the risks of a market downturn to safeguard your retirement savings. The heatmaps don’t reflect that ... The heatmap doesn’t tell you how your super has performed over your lifetime, it can’t tell you whether your fund invests in accordance with your ethical and philosophical beliefs, and it doesn’t tell you what additional services they offer to help you manage your savings.
The media headlines have already focussed on particular examples, and their trustees will need to address the results. For example, some BT Super funds are flush with deep red colours and must face APRA’s gaze, and only 15 funds scored ‘white’ across all categories.
An industry fund with some deep red, Christian Super, which traditionally takes a more defensive investment approach, said the heatmap may cause investment teams to focus too much on peer performance resulting in herding of results to aviod becoming an outlier.
The Association of Superannuation Funds of Australia (see ASFA website) has also urged caution, with CEO Martin Fahy saying:
“Let’s be careful however not to jump to erroneous conclusions that may impact the entire category, or damage member outcomes with knee-jerk reactions from anti-retirement groups … achieving sound investment performance and broader member outcomes is a long-term journey, it’s not measured in terms of years, it’s measured in terms of decades.”
Other industry participants, such as SuperRatings, question why APRA is even publishing such results, arguing a regulator should be regulating not managing a public scoring system
The bottom line is the industry must accept the regular updates from an emboldened APRA, and it just became even more difficult to discharge the duties of a super trustee.
Graham Hand is Managing Editor of Firstlinks.