Time flies in the world of investments, and the themes that were emerging last year have gathered speed, including high realised and anticipated inflation, a risk of a global recession and the outbreak of the Russia-Ukraine conflict. In this context, we have revisited the question of how Value stocks are performing, especially versus Growth.
(Note. A Growth stock is any share in a company that is anticipated to grow at a rate significantly above the average growth for the market. A Value stock is a share trading at a lower price than the intrinsics of company's performance may otherwise indicate).
The story so far
Inflation commentary has moved from ‘transient’ to ‘temporary’ to ‘sticky’ and is now approaching ‘entrenched’ at a fast clip.
During this period of uncertainty, Value stocks have performed well, which coincides with (but is not entirely driven by) higher inflation. Very expensive Growth stocks, hit both by slowing growth and by inability to source materials, have sold off significantly.
We believe Value will continue to do well for some time (or Growth will do poorly), as the issues driving inflation are unlikely to be resolved any time soon, and the knock-on impacts will take some time to filter through.
How has Value performed?
While there is a fairly well-known, positive relationship between the returns to Value and inflation, the relationship is by no means simple. It was probably greater in the high-inflation period of the 1970s when oil prices were high and inflation was not targeted by central banks, as it is today.
However, two comments on this relationship:
1. Inflation is up, is sticky and is expected to stay high for some time
We know that higher inflation means higher nominal interest rates, and higher cost of debt for companies. Companies that rely on longer-dated cash flows for their valuation – so-called ‘long duration’ companies – are much more affected by increases in interest rates than those with shorter duration. These longer duration names are typically the expensive Growth stocks and are devalued and sold off more than shorter duration stocks, which are typically the cheaper Value-style companies.
2. Economic growth expectations are muted
When projections of expected growth and future cashflows are positive, the market is willing to pay up for expensive stocks, betting that things will go well. However, if this growth is interrupted, as it has been recently, the expectations are less optimistic and expensive companies are sold off in favour of companies with more certain short-term opportunities, especially those that are cheaper.
It's both an 'expensive' and 'risky' story
In combination, these two effects have played out as expected with Value significantly outperforming Growth over the last 6-9 months in most markets. The charts below show this.
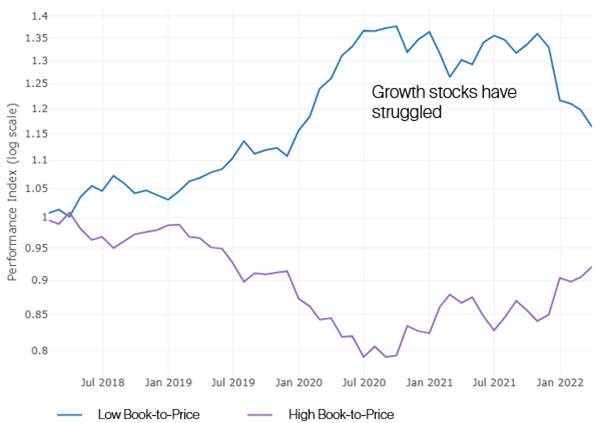
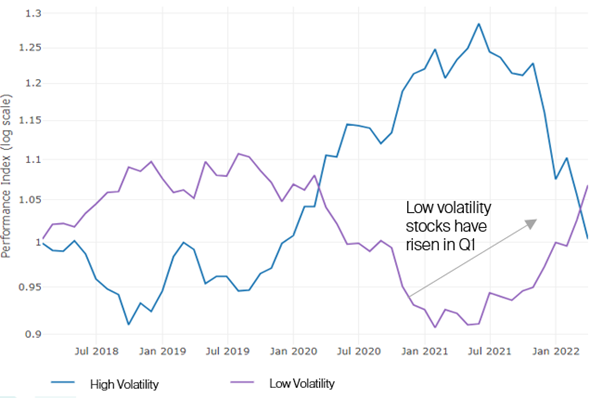
The first chart shows that the performance of Value and Growth (measured here as the top and bottom quintiles of Book-to-Price) stopped diverging in the middle of 2021, and Value has had a resurgence. However, as the second chart shows, the story has also been about certainty. Low volatility (i.e. low risk) stocks have significantly beaten high-volatility/high-risk names since the middle of last year.
(Note. Book to Price is a valuation metric that compares a company’s current market value to its book value).
We have thus seen a two-fold rotation – away from expensive Growth to cheaper Value, and away from risky Growth to more stable Value.
Chart 1: Top and bottom quintile performance of 12-month volatility (MSCI ACWI ex AU)
Source: Realindex, Factset. Data as at 30 April 2022
Chart 2: Top and bottom quintile performance of Book-to-Price (MSCI ACWI ex AU)
Source: Realindex, Factset. Data as at 30 April 2022
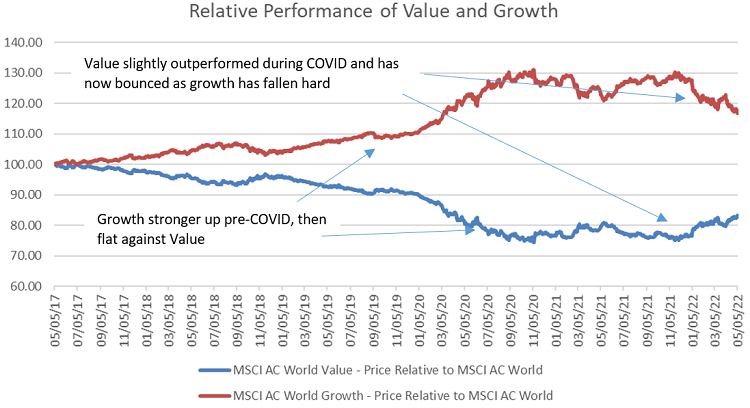
The next two charts break down this difference in performance between the All-World (ACWI) and Australian universes since the start of 2022. In each case, the outperformance of Value over Growth has been stark.
Chart 3: Outperformance of Value over Growth MSCI ACWI ex AU
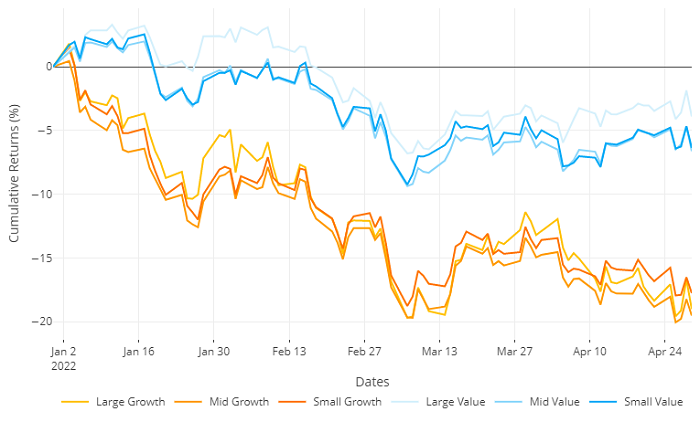
Source: Realindex, Factset. Data as at 30 April 2022
Chart 4: Outperformance of Value over Growth ASX 200
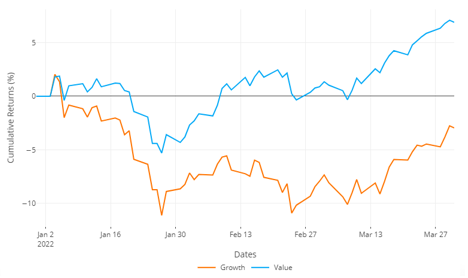
Source: Realindex, Factset. Data as at 30 April 2022
Do we expect it to continue?
Increases in realised or expected inflation tend to be correlated with a positive, relative return to Value, when compared to Growth.
Prior to COVID, an average inflation rate of around 2% was expected by the market over the following 10 years. With COVID, this fell sharply as economic contraction was likely. Since then it has rebounded, passed back through 2% and is now approaching 3%.
The standard measure for expected inflation is known as 'Bond Breakeven Inflation Rate” (BBIR), and in the most recent two months, the BBIR has spiked from 2.5% to near 3%.
The recent outperformance of Value has tracked some of this change in inflation expectations, more because of the sell-off in Growth than a strong bounce in Value (although this has happened too).
Chart 5: Breakeven Inflation and the Value-Growth Spread
Source: Realindex, Factset. Data as at 5 May 2022
We cannot, of course, draw a direct link between expected inflation and future performance of Value, although there is clearly a strong recent relationship.
While Value has done well recently, the cumulative outperformance of Growth over Value over the last decade is still much larger, and we can see that the trend in spreads of Valuation metrics has only corrected a little. This gives us some comfort that the Value resurgence still has a long way to run.
David Walsh is Head of Investments at Realindex Investments, a wholly owned investment management subsidiary of First Sentier Investors, a sponsor of Firstlinks. This article is general information and does not consider the circumstances of any investor.
For more articles and papers from First Sentier Investors, please click here.