More than three years have passed since February 2020, a once-in-a-century month that saw economists, governments and healthcare leaders brace for impact as the COVID-19 global pandemic took hold. Shortly after, many global borders closed and markets tumbled.
To the world’s surprise, the acute market fallout quickly reversed. Australian equities climbed almost 60% to all-time highs, with Big Tech and ETFs dominating headlines. But fast forward three years to today, the rebound is not so clear-cut. Global economic and political events – including the war in Ukraine, rising energy costs and persistent inflation – have created challenges for investors.
For the average Australian retail investor, 2023 has already delivered its fair share of financial challenges. The Reserve Bank of Australia’s 12 interest rate rises in response to inflation has further driven up the cost of living and the average family now pays $7,102 per month just to live and pay bills.
When it comes to equities, retail investors not only have less free cash available to invest, but are also weighing up increasingly competitive cash and fixed interest products such as fixed income, term deposits and savings accounts. As Wall Street forecaster Jim Bianco said, rightly or wrongly, “Cash is no longer trash… you are going to get two-thirds of the long-term appreciation of the stock market with no risk at all”.
So how are today’s equity investors positioning their portfolios compared with how they invested several years ago?
Fintech platform, Openmarkets, recently assessed the portfolios and trading behaviours of almost 100,000 sponsored accounts between February 2020 and today. We’ve noted a number of interesting themes.
Today’s equity investors have a low risk appetite
Australia’s equity investors are the most defensive they’ve been in some time, focusing their trading on large cap companies with large cash reserves and minimal exposure to inflationary pressures in their supply chains.
According to our Investor Defensiveness Index, which ranges from -10 (defensive) to +10 (offensive), Australians were defensive in February 2020 as investors weighed up the market implications of closed borders and global lockdowns. By 2021, a year where hype stocks and finfluencers dominated the press, this cohort shifted to an offensive mindset who were more likely to take on risk. This offensiveness remained in 2022 through the Russia-Ukraine war and the beginning of interest rate rises, before rapidly reducing in 2023. Today, investors have adopted a stance significantly more defensive than at the start of the COVID-19 pandemic.
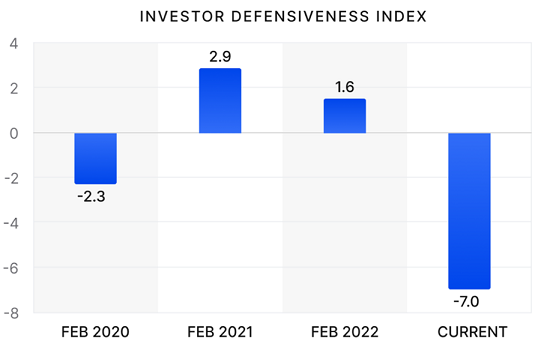
Fig 1. Openmarkets Investor Defensiveness Index Feb 2020 - May 2023 (Openmarkets data)
From a company size perspective, the past 12 months saw the highest volume of large cap ASX equities traded compared with the prior three years. Interest in higher risk small caps has fallen from a peak in 2021 to 42% of total equities traded. These findings point to a reduction in appetite from investors to take on risk in current market conditions.
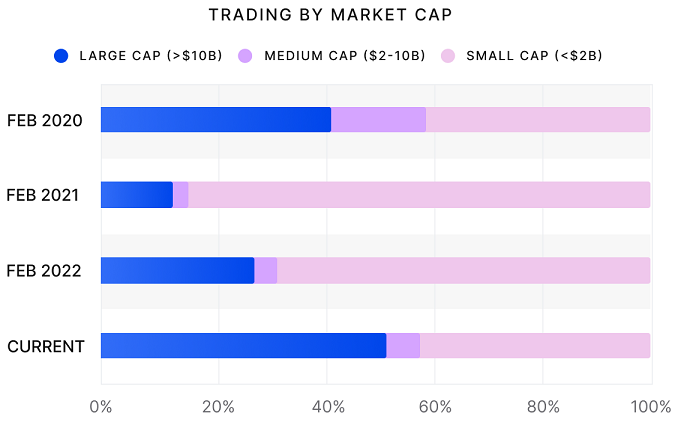
Fig 2. Trading by market cap in Feb 2020 vs May 2023 (Openmarkets data)
Diversification is on the decline in 2023
Despite Australian equity investors focusing on lowering risk, our data shows that not all investment behaviours are defensive.
Over the past 12 months, we have seen a surprising decline in the number of equities held by the average sponsored account holder. Portfolio diversity on average has fallen between 4.3% and 5.6% depending on age bracket, with Generation Y and Z showing the greatest portfolio reductions to hold an average of 4.5 stocks.
Baby Boomers reduced their ETF holdings by 7.4%, while Gen Y and Z reduced their ETF holdings by 3.3%.
Despite this decrease, Baby Boomers remain the age group with the most diversified holdings. The average Boomer holds nine stocks in their portfolio, compared with Gen X who hold six and Gen Y and Z who hold 4.5 stocks.
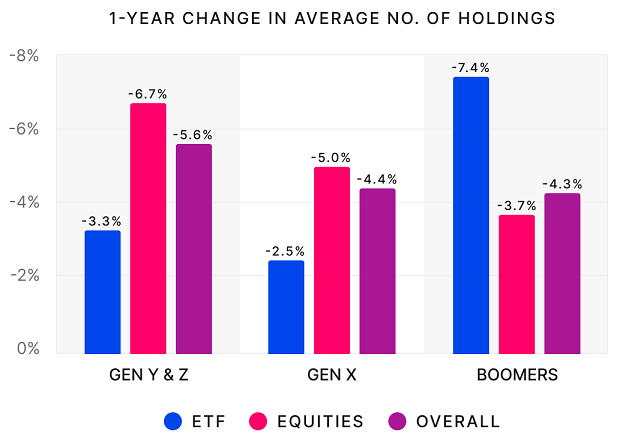
Fig 3. 1-year change in average number of holdings by generation (Openmarkets data)
Selling materials while navigating tech sector price swings
Throughout the pandemic, materials was our cohort’s most bought sector, topping buying activity in both 2020 and 2021. Materials buying stayed strong in 2023 until Q2, where concerns of stagnating economic growth in China have now driven a major reversal in sentiment. The subsequent selling in Q2 has led to a flip in materials to become the most sold sector over 12-months. The most sold stock is Mineral Resources Ltd (ASX: MIN) and the most bought is Iluka Resources Limited (ASX: ILU). Back in February 2020, it was Fortescue Metals (ASX: FMG) that saw the highest buying activity.
Despite this sentiment reversal, it barely compares with the magnitude of price swings that Australia’s technology sector has seen since February 2020. Tech was famously prized in 2021 and 2022 as investors recognised skyrocketing demand for online cloud-based and remote working services. The ‘tech wreck’ followed in early 2023; a period where many sold their tech holdings off the back of poor US third quarter earnings performance, staff cuts and a general shift away from growth stocks. Now, in May 2023, we’ve seen appetite rebound as the transformative potential for generative artificial intelligence (AI) is recognised. In February 2020, our most bought Australian tech stock was Link Administration Holdings (ASX: LNK) but today, it’s TechnologyOne (ASX: TNE), an enterprise SaaS software developer that uses AI in its products.
Financial advisers and wealth managers have a vital role to play
Volatile market conditions will likely prevail heading into the next quarter. Markets are now expecting a mild US recession and possibly a recession in other major markets. Australian households will continue to feel the impact of higher interest rates, putting more pressure on household budgets and creating less free cashflow with which to invest. Despite this, we expect trading activity will remain steady in the period ahead.
In these conditions, wealth management and financial advice providers have a critical role to play in ensuring their clients’ portfolios have robust risk management approaches in-place, such as via diversification, exposure to defensive sectors and balancing resilient income with capital growth.
Note: The Investor Defensiveness Index measures the buy/sell ratio of low beta (defensive) stocks relative to high beta (volatile) stocks. We consider -10.0 to 0.0 to be defensive, and 0.0 to +10.0 to be offensive.
The investor defensiveness calculation is:
- Over the measured period (May 2023 for example), each trade across all ASX stocks is allocated to one of seven groups based on the beta of the underlying asset. Each of group has an approximately equal number of trades.
- The buy/sell ratio of each group is calculated and converted into an index based on the historical buy/sell ratio of that group (the greater the value, the higher the buy/sell ratio is now relative to historical data).
A linear regression is conducted on the sentiment index against beta, with the negative slope of the line-of-best-fit being the Investor Defensiveness Index.
Dan Jowett is CEO at Openmarkets Group. This article is general information and does not consider the circumstances of any investor.