Register For Our Mailing List

Register to receive our free weekly newsletter including editorials.

Home / 291

Know what you own in complex markets

The world economy is experiencing massive shifts involving changes in consumer and business behavior. These shifts have largely been driven by technological advancements combined with where we are in the current business cycle. However, it may not be enough to own the companies behind this innovation and disruption, as these shifts are likely to create ongoing swings in profit pools over the next 10 years and beyond. It may be just as important to avoid companies adversely impacted.

It is critical to ‘know what you own’ in terms of profitability and earnings growth in such a complex market environment.

Earnings drive equity returns

Why do we spend so much of our time evaluating the potential earnings and profitability of companies? It’s because, over time, earnings generally drive equity returns, as shown below for 20 years between 1998 and 2018. Despite short-term dislocation, which is typically the result of substantive macro risks, stock prices usually reflect the earnings growth of companies. Show me a chart of a company’s earnings growth and I’ll show you a chart of a company’s stock price.

The strong correlation of earnings and equity returns

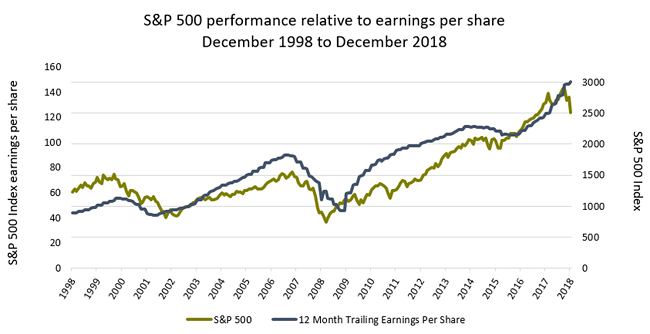
Source: Bloomberg, 31 December 2018

For example, US market earnings growth has been significantly higher than that of non-US markets in the wake of the global financial crisis, and thus we see the greater comparative advance of the US stock market.

The historical trend favouring quality 

Another way to look at the dynamic between profitability and stock prices is through a quality lens that shows companies with positive earnings generally outperform companies with negative earnings by a significant margin, as shown below.

Quality has performed again after taking a breather

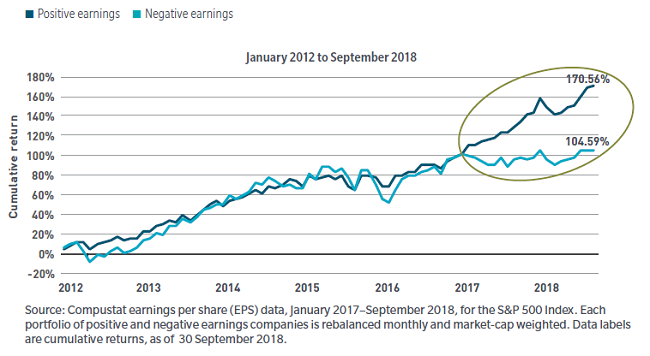
However, there are exceptions to this trend. From 2012 to the end of 2016, you couldn’t tell the difference between the stock prices of positive and negative earners. There were many reasons for this, including the global central banks accommodative policy creating massive amounts of liquidity, as well as the proliferation of passive investing. It was akin to an episode of Shark Tank in which the investors give money to entrepreneurs whether their ideas have merit or not. However, since 2016, the symbiotic dynamic of profitability and stock prices has been restored, which has led to the significant outperformance of the positive versus negative earners.

Differentiation and the alpha generation connection

We have witnessed this scenario play out in our own portfolios. From 2010 to 2015, company financial quality showed less differentiation, as the lower-quality companies we chose not to own generally outperformed. It’s no coincidence that this dynamic changed recently, when the Federal Reserve started raising interest rates in a consistent fashion, which also aligns with the charts above. We believe in overweighting companies that we value highly, as well as underweighting (or avoiding all together) stocks in the benchmark where we question the underlying fundamentals and future earnings potential.

In addition to higher rates, it’s becoming increasingly difficult for businesses to maintain a sustainable competitive advantage, or barrier to entry, to drive future earnings growth. This is largely due to the massive disintermediation in more traditional sectors and industries (an example is Amazon’s impact on bricks-and-mortar retailing) combined with peak profit margins for many companies at this stage in the cycle.


Nicholas Paul is an Institutional Portfolio Manager at MFS Investment Management. The comments, opinions and analysis are for general information purposes only and are not investment advice or a complete analysis of every material fact regarding any investment. Comments, opinions and analysis are rendered as of the date given and may change without notice due to market conditions and other factors. This article is issued in Australia by MFS International Australia Pty Ltd (ABN 68 607 579 537, AFSL 485343), a sponsor of Cuffelinks.

For more articles and papers from MFS Investment Management, please click here.


RELATED ARTICLES

Which shares and funds do SMSFs invest in?

The growth outperformance myth

Hold fire on your fund manager over short-term declines

banner

Most viewed in recent weeks

Australian house prices close in on world record

Sydney is set to become the world’s most expensive city for housing over the next 12 months, a new report shows. Our other major cities aren’t far behind unless there are major changes to improve housing affordability.

The case for the $3 million super tax

The Government's proposed tax has copped a lot of flack though I think it's a reasonable approach to improve the long-term sustainability of superannuation and the retirement income system. Here’s why.

7 examples of how the new super tax will be calculated

You've no doubt heard about Division 296. These case studies show what people at various levels above the $3 million threshold might need to pay the ATO, with examples ranging from under $500 to more than $35,000.

The revolt against Baby Boomer wealth

The $3m super tax could be put down to the Government needing money and the wealthy being easy targets. It’s deeper than that though and this looks at the factors behind the policy and why more taxes on the wealthy are coming.

Meg on SMSFs: Withdrawing assets ahead of the $3m super tax

The super tax has caused an almighty scuffle, but for SMSFs impacted by the proposed tax, a big question remains: what should they do now? Here are ideas for those wanting to withdraw money from their SMSF.

The super tax and the defined benefits scandal

Australia's superannuation inequities date back to poor decisions made by Parliament two decades ago. If super for the wealthy needs resetting, so too does the defined benefits schemes for our public servants.

Latest Updates

Planning

Will young Australians be better off than their parents?

For much of Australia’s history, each new generation has been better off than the last: better jobs and incomes as well as improved living standards. A new report assesses whether this time may be different.

Superannuation

The rubbery numbers behind super tax concessions

In selling the super tax, Labor has repeated Treasury claims of there being $50 billion in super tax concessions annually, mostly flowing to high-income earners. This figure is vastly overstated.

Investment strategies

A steady road to getting rich

The latest lists of Australia’s wealthiest individuals show that while overall wealth has continued to rise, gains by individuals haven't been uniform. Many might have been better off adopting a simpler investment strategy.

Economy

Would a corporate tax cut boost productivity in Australia?

As inflation eases, the Albanese government is switching its focus to lifting Australia’s sluggish productivity. Can corporate tax cuts reboot growth - or are we chasing a theory that doesn’t quite work here?

Are V-shaped market recoveries becoming more frequent?

April’s sharp rebound may feel familiar, but are V-shaped recoveries really more common in the post-COVID world? A look at market history suggests otherwise and hints that a common bias might be skewing perceptions.

Investment strategies

Asset allocation in a world of riskier developed markets

Old distinctions between developed and emerging market bonds no longer hold true. At a time where true diversification matters more than ever, this has big ramifications for the way that portfolios should be constructed.

Investment strategies

Top 5 investment reads

As the July school holiday break nears, here are some investment classics to put onto your reading list. The books offer lessons in investment strategy, financial disasters, and mergers and acquisitions.

Sponsors

Alliances

© 2025 Morningstar, Inc. All rights reserved.

Disclaimer
The data, research and opinions provided here are for information purposes; are not an offer to buy or sell a security; and are not warranted to be correct, complete or accurate. Morningstar, its affiliates, and third-party content providers are not responsible for any investment decisions, damages or losses resulting from, or related to, the data and analyses or their use. To the extent any content is general advice, it has been prepared for clients of Morningstar Australasia Pty Ltd (ABN: 95 090 665 544, AFSL: 240892), without reference to your financial objectives, situation or needs. For more information refer to our Financial Services Guide. You should consider the advice in light of these matters and if applicable, the relevant Product Disclosure Statement before making any decision to invest. Past performance does not necessarily indicate a financial product’s future performance. To obtain advice tailored to your situation, contact a professional financial adviser. Articles are current as at date of publication.
This website contains information and opinions provided by third parties. Inclusion of this information does not necessarily represent Morningstar’s positions, strategies or opinions and should not be considered an endorsement by Morningstar.