A cursory look at the headline performance of the Australian listed property trusts, or as they are now more commonly known, Australian real estate investment trusts (A-REITs), would suggest all is not well. The S&P/ASX300 A-REIT Index posted a total return of -5.6% in the year to 30 June 2017, underperforming the equities market, which returned 13.8%. The underlying direct property market returned circa 12%.
The headline index performance is deceiving and the composition of the S&P/ASX300 A-REIT Index is fundamentally flawed. Like most indices, it is weighted by the market capitalisation of each security. The larger A-REIT securities such as Scentre (ASX:SCG), Westfield (ASX:WFD) and Stockland (ASX:SGP) have a higher weighting in the Index. It says nothing about the merit of a particular security.
Investors are continually reminded not to put all their eggs in one basket and avoid taking concentration risk. We are told to diversify, diversify, and diversify. Yet the A-REIT Index fails that test. The top eight A-REITs comprise a staggering 78% of the Index by market capitalization, as shown in the figure below. The performance of these A-REITs has a massive influence on the Index and the sector.
S&P/ASX 300 A-REIT Index Market Capitalisation – June 2017
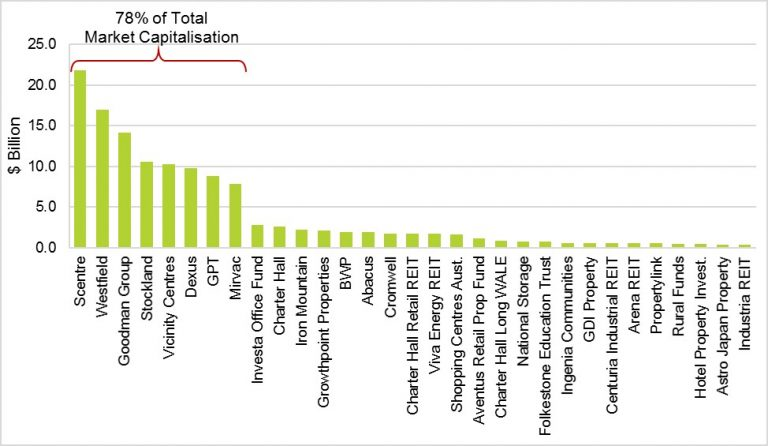
Source: IRESS
Impact of the largest companies
The median performance of the top eight A-REITs by market capitalisation was -3%. The big guns, apart from Goodman Group (14.3%), were hit particularly hard – Westfield (-21.5%), SCentre (-13.4%) and Vicinity (-17.3%) as can be seen in the figure below.
A-REITs Performance – 12 Months to 30 June 2017
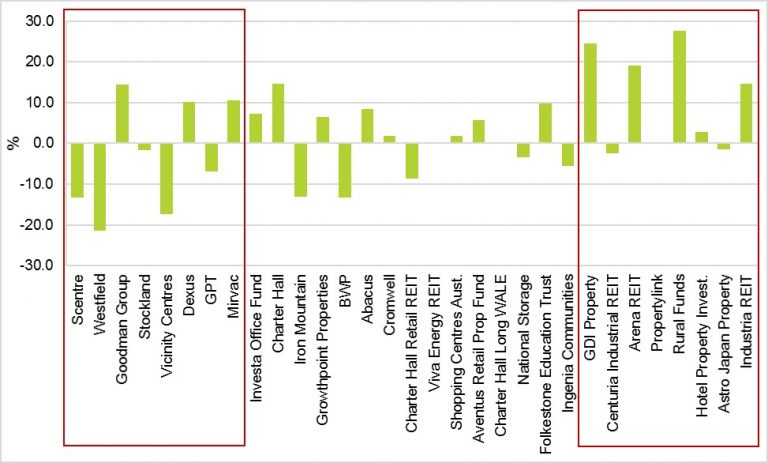
Source: IRESS
The sell-off in the larger cap stocks was driven mainly by two factors.
Firstly, concerns about the retail sector saw Westfield, Scentre and Vicinty sold-off (like several of the listed retailers) despite all three owning some of the best retail assets in the country.
Secondly, in recent years the A-REIT sector has attracted significant inflows from institutional and global capital chasing its attractive yield. However, as bond yields started rising (the 10-year bond yield rose from 2% to 2.6% during FY17) the sector’s ‘bond-like’ defensive characteristics become less attractive to some investors. The larger, more liquid A-REITs, in particular, came under pressure. Some institutional and global investors started to rotate out of A-REITs into other cyclical sectors of the equities market or redeployed their capital into offshore markets.
At the other end of the scale, the median performance of the smallest eight A-REITs in the Index was a positive 9.9% for the year to 30 June 2017. Of these, Rural Funds Group, GDI Property and Arena REIT were the standouts, delivering stellar returns to investors.
Index does not cover the whole market
Another flaw in the Index is that it only captures 31 listed A-REITs. There are another 15 that are considered too small to be included, typically with a market capitalisation below $350 million. For institutional investors, these A-REITs are not big enough to invest in. Many outside the Index are well managed, have excellent real estate portfolios and performed well in the past year, including Centuria Metropolitan Office REIT (25.5% return) and Australian Unity Office Fund (11.4% return).
Finally, the Index is flawed given its sector composition does not reflect the broader real estate market. Retail A-REITs comprise 45% of the Index, well ahead of diversified A-REITs at 27%, office and industrial A-REITs both at 12%, and specialised A-REITs is a minnow comprising just 4% of the Index. Office, retail and industrial are far more dominant sectors across the real estate landscape.
If we drill down to the underlying asset level and include the retail centres owned by the major diversified AREITs – GPT, Stockland, Mirvac – the exposure to retail is more than 50% of the total assets owned by the sector. Given the structural and cyclical issues currently facing retail, that is a massive bet on the retail sector for anyone invested in the Index.
The arrival of international retailers in recent years including Zara, H&M and Uniqlo has reshaped retail. At the same time, local retailers such as Dick Smith, Payless Shoes and Rhodes & Beckett have disappeared. Retail sales numbers reveal anaemic spending, and the growth of online retail spending continues to gain momentum, even before the Amazon juggernaut hits our shores. It is not surprising that the past year median performance of the retail A-REITs was down 9.5%.
As the past year has shown, the overall performance of the A-REIT Index masks a wide variation in performance across individual A-REIT securities. FY18 is unlikely to be any different given the way the Index is constructed and the likely on-going short-term volatility in A-REIT pricing. Investors who are prepared to avoid using a passive market cap index fund can go hunting for individual A-REIT securities based on merit and attractive pricing. Otherwise, investing with an A-REIT securities fund manager that utilises a high conviction, benchmark (index) unaware investment process, will be well placed to deliver returns well above the headline A-REIT Index in the year ahead.
Adrian Harrington is Head of Funds Management at Folkestone (ASX:FLK). This article is general information that does not consider the circumstances of any individual.