The extra return paid to investors for taking risk has been heavily influenced by the reach for yield. It affects many spread margins (or excess returns) such as on high-yielding corporate bonds and (even) ordinary equity.
With cash and bond rates set to remain ‘lower for longer’, the transfer mechanism from 'risk free' with almost zero return to 'risk on' becomes self-fulfilling. This is the situation that Australia now finds itself in. Low interest rates, predicted by the 10-year bond rate to remain so for an extended period, assist with benign corporate and household default conditions.
Breakeven analysis: term deposit versus hybrid
As the reach for yield intensifies, do investors know if the return on invested capital at risk is sufficient compensation versus the risk-free rate to justify the investment? This is the question investors should always ask themselves before making any investment.
There is no right or wrong answer because individual investor risk tolerances vary. For example, we might assess hybrid capital instruments to have little risk at present arguing that the improved credit health of the issuers justifies pricing closer to more senior instruments of the same issuer. However, other investors will rank them only marginally ahead of ordinary equity perceiving them to be highly risky.
We use a number of methods to assess the risks inherent in individual securities and in aggregate terms, in our portfolios. One method, breakeven analysis, provides us with a relatively simple method of assessing whether the excess return over a prescribed benchmark index or even the risk-free rate provides sufficient compensation for the additional risk. It helps to compare assets of differing seniority, term and credit quality.
Using an example of a major Australian bank term deposit returning approximately 1% on an annual basis and the PERLS VII hybrid capital instrument (ASX:CBAPD), currently yielding approximately 3.5% per annum, puts the excess return in perspective.
Assume $100 is invested in a term deposit for 2 years (a reasonable time frame) at 1% per annum. Ignoring compound interest, investors earn $2 or 2% over the 2-year period.
Now, investing in CBAPD, we can assume the floating benchmark reference rate will be 1% (i.e. BBSW), the return over the same period, including the value of franking, will be 3.5% in year 1 followed by 3.5% in year 2, a total of $7 or 7%.
While the return is 3.5 times the risk-free term deposit rate, the investment is in a ‘risk’ asset where there is some probability, albeit a very low, of a capital loss over the period. Using breakeven analysis, it is possible to make a value judgement on the return versus the risk.
Making sense of the numbers
Let’s assume there is an ‘event’ and the capital value of the hybrid CBAPD declines. The question you should ask is:
How far does the capital value of CBAPD have to fall by the end of the period (i.e 2 years) before an investor would have been better off investing in the term deposit?
The capital loss on CBAPD would have to be greater than $5 (i.e the difference between earnings on CBAPD and the term deposit) before you would have been better off in the term deposit.
That is, if you buy CBAPD at $100 today you could sell it for $95 at the end of the period (year 2) and be no worse off than investing in the term deposit at 1% p.a. for 2 years. The table below summarises this information.
|
|
Income (annual rate)
|
Return @ end 2 years
|
Amount Invested
|
Income earned on $100 over 2 years
|
At end year 2 ($100 + income)
|
Breakeven CBAPD price @ end year 2 to = 2-year TD income
|
|
2-year TD
|
1%
|
2%
|
$100
|
$2
|
$102
|
n/a
|
|
CBAPD
|
3.50%
|
7%
|
$100
|
$7
|
$107
|
$95
|
What does this tell us?
The interesting fact is that at a price of $95 in 2 years’ time (in January 2022), the yield-to-maturity to the first call in December 2022 of CBAPD would approximate to 9% per annum. That is, the change in capital value plus the coupon and franking. At 9%, the spread margin represents an excess margin of 800 basis points or 8% over the risk-free rate which would be amazing value, everything being equal, for an asset of that credit quality (CBA risk) and term (one year).
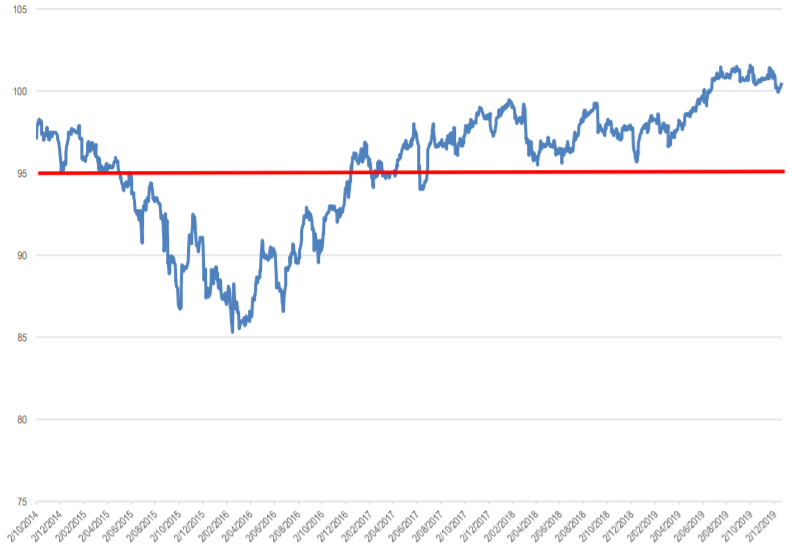
While CBAPD has traded at a price below $95 in its life since its 2014 issuance, as shown below, it was only for a 12-month period in 2015 and 2016 when the term to maturity (first call) was in excess of five years. Since then it has traded at a price in excess of $95 and more recently above $100 (the security’s par value) reflecting a rerating of the risks associated with major bank hybrids and a shortening term to maturity or first call specific to the CBAPD security.
CBAPD Price Daily October 2014 to December 15, 2019
… but diversification is still key
While our portfolios are of similar term and similar average weighted credit quality to the example above, the important difference is that our portfolios contain 35 securities spread across a range of sectors and sub sectors, including banking, insurance, building and construction and infrastructure. The risks associated with investing in a single individual security are significantly reduced. Even with a credit of the quality of CBA, it's worth spreading the risk to other quality names. It is also possible that CBA will not call the hybrid at its first call date, although banks are reluctant to do this as it affects their subsequent visits to the market.
Norman Derham is Executive Director of Elstree Investment Management, a boutique fixed income fund manager. This article is general information and does not consider the circumstances of any individual investor.