As the proposed new Division 296 superannuation tax continues to be debated, Treasury’s Tax Expenditures and Insights Statement (TEIS), often enters the conversation. It quotes a total super tax concessions figure in the vicinity of $50 billion annually, a misleading figure that the proposed new super tax relies heavily upon for justification.
Misleading in the sense that it is based on an inappropriate benchmark for cost purposes, comparing the 15% tax on super contributions and earnings to what would have otherwise been collected if the individual’s marginal tax rate had applied.
The problem with this approach is that it ignores restrictions on access to super savings until retirement age, and that there is a compulsory element to contributions. This reduces the real value of super savings compared to funds readily available today. A more realistic attempt at calculating the tax concessions would apply a liquidity discount to account for inaccessibility. Treasury’s report also ignores behavioural changes in the absence of tax concessions.
In assuming super tax concessions are immediate give aways, the TEIS overlooks the real economic costs to individuals of tying up funds for decades. Calculating a liquidity cost to future savings would yield a more accurate assessment of any tax concessions. So what might a liquidity discount look like, and how would it be applied?
Quoting David Laibson in The Quarterly Journal of Economics, Vol. 112, No.2 (1997): “Individuals often require more than a doubling or tripling of current consumption to defer gratification for a few decades.” Noting that behavioural experiments typically use nominal dollars, without reference to inflation, as people don’t generally adjust for that mentally.
And if deferring consumption was compulsory, you could argue for a multiple greater than two to three times.
An example
So let’s assume someone might be indifferent to having $100 today or $300 in 30 years’ time.
Implying that for any investment inaccessible for 30 years, the individual would value the expected maturity value at one-third of that amount, in today’s terms. Which represents a 66.7% discount on the future value, or annually, a liquidity discount rate of 3.73%.
Even though an investment is expected to grow to a certain dollar value, the individual perceives it as worth only one-third of that because they can’t access it for 30 years. That is a loss of value in utility terms, not in nominal dollars.
If however, no restrictions applied to accessing funds over the 30 year period, then a liquidity discount would not apply, and the individual would value the investment at its full expected future value.
Note that liquidity discounting is independent of investment performance. Rather, it is about how much a person devalues locked up money because they are unable to draw on it if needed, reallocate it if a better opportunity arises, or smooth consumption over time. In other words, the kind of behaviour the TEIS overlooks when it treats concessional tax rates as benefits without recognising the cost of loss of liquidity.
In reality, an individual’s annual liquidity discount rate would decrease as time to accessibility of funds approaches. For example, a 35-year-old would value $100 available in 25 years’ time, less than a 55-year-old would value it in five years from now. The annual cost of foregone consumption or opportunity shrinks with time to access. And the decline in discount rate would not be linear, with a steadier drop from younger ages when there is a higher premium on liquidity and more uncertainty, to an accelerating decline as retirement approaches and the discount rate approaches zero.
The result being a curve with a non-linear concave decline as time to access approaches zero. Beginning with a maximum annual liquidity discount rate of 3.73%, such a curve might look like this:
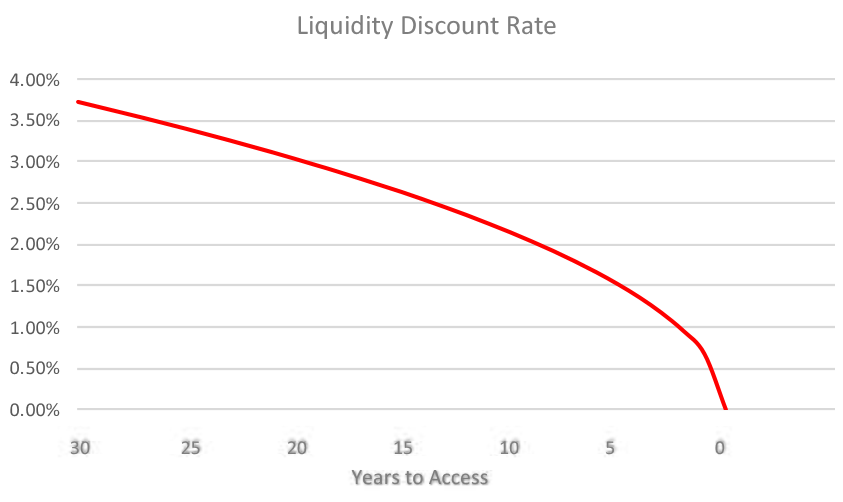
This curve can be used to discount a stream of super fund contributions for illiquidity.
For example, suppose $100 per year goes into a super account for 30 years earning 5% p.a. before tax. That is, $85 per year earning 4.25% after 15% tax, would accumulate to $5,183.
Applying the discount curve to this fund reduces the accumulated value to $3,567. That is, for this individual, the accumulated value of $5,183 in 30 years would be equivalent to $3,567 in today’s terms. This represents an overall discount for illiquidity of 31.2%, which would seem intuitively modest when forgoing access to funds for a full 30 years.
By comparison, assume the same contributions went into an ordinary taxed fund with no access restrictions, and a 30% marginal tax rate. Then $70 per year earning 3.5% after tax would accumulate to $3,740. Which is more than the super fund’s discounted value of $3,567.
If, however, the super fund tax rate was lowered to 12.6%, then its accumulated value adjusted for illiquidity would be equal to the ordinary taxed fund’s value.
That is, a fund with full access taxed at 30% accumulates to $3,740. A fund locked up and taxed at 12.6%, and allowing for illiquidity accumulates to $3,740. So a drop in tax rate from 30% to 12.6% is needed to compensate this individual for locking up his funds for 30 years.
But this individual would be paying 15% tax, so clearly there are no tax concessions for him. Yet the TEIS implies that he is the recipient of concessions because of benchmarking to his 30% marginal tax rate.
Going through the same process with a 37% marginal tax rate would yield a required super tax rate of 20.9% to compensate the investor for illiquidity. In that instance there would be small tax concessions when comparing to a tax rate of 15%.
And a 45% marginal rate translates to a required 30.5% super tax rate. Again, concessions exist, but certainly not to the extent of the 15% super tax rate being assessed against 45%.
And if the same analysis is undertaken for a 40-year scenario, the following results are obtained:
Marginal tax rate | Super tax rate required
30% | 5.6%
37% | 14.3%
45% | 24.3%
That is, even less tax concessions, which makes intuitive sense when funds are locked up for an extra ten years.
Note that this analysis is based on a specific discount rate curve for illiquidity, the rate and shape of which can vary depending on individual circumstances like age, income level, family status, and so on. Even though there is no widely agreed discount rate size or profile, it could be estimated for example, by comparing returns between liquid and illiquid assets. Or it could be based on choice experiments that reveal results like an indifference between having something now, or a multiple of that in decades time. It could also be based on opportunity costs where individuals forgo access to funds, but have mortgage and/or credit card debt.
The need for an honest assessment
Suffice to say that illiquidity costs are real and discount rates will not be zero. While there may be a budgetary cost to running a superannuation system, there is also a personal economic cost, because locking up money long term is not free, and the assumption of a 0% liquidity premium in the TEIS is unrealistic. It is difficult to estimate without data, but modest discounting might as much as halve the value of super tax concessions reported.
If government is going to motivate people to save for retirement, it must be prepared to offer meaningful incentives to individuals for giving up access to large sums of money for many years. A reduced tax rate is one way, with the amount of reduction debatable. And if Treasury is going to introduce measures to help sway the debate, surely it has a duty to estimate those measures as accurately as possible.
Tony Dillon is a freelance writer and former actuary.