The financial press regularly quotes someone referring to 'the 30-year bull market in bonds'. Often, they’re reporting the latest prediction that this amazing period of (alleged) bond market prosperity is about to come to a crashing end. This article reviews the history of bond yields, prices and returns to explain what the bond market has really done for the past few decades. This can help to understand what various future scenarios might actually mean.
The problem with characterising the past 30 years or so as a 'bull market in bonds' is that it’s not an accurate depiction. Reality simply doesn’t support the statement.
Always worth par on maturity
Most commentators speak of the long-run trend in US bond yields when they refer to the 30-year bull market. The following chart (courtesy of Macrotrends) gives a 54-year history of 10-year US Treasury bond yields.
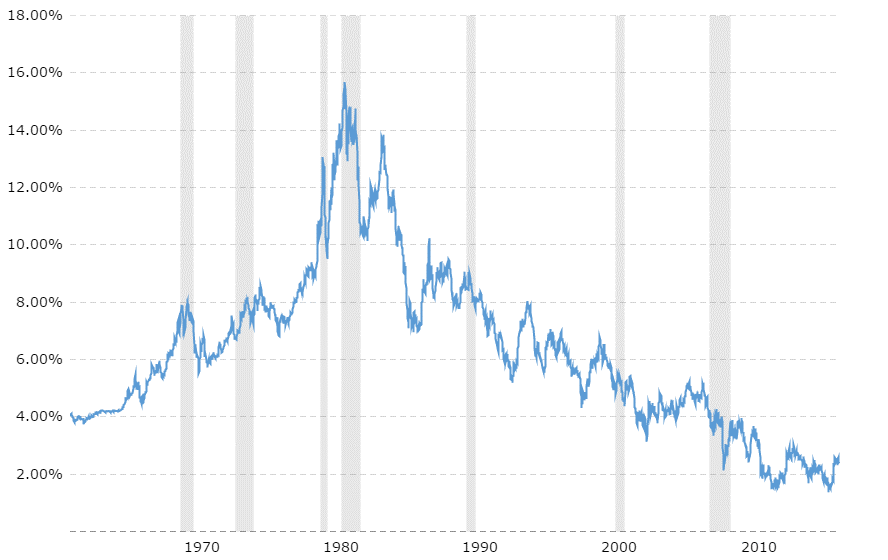
Bond yields were at an all-time peak 36 years ago and have in recent years been at all-time lows. (The peak was in 1981 and the low point in 2012.) Commentators naively infer that bond prices must, therefore, be a lot higher because when yields fall, prices rise. Ipso facto, we’ve had a multi-decade bull market in bonds!
However, it’s wrong to simplistically turn a long-term change in yields into an on-going bull market. A simple question will help you understand why it’s not possible: when it matures next month, what will be the price of the May 2017 US Treasury bond that was issued in 1987 at par value of $100? If there’s been a 30-year bull market then surely this bond is now worth thousands of dollars.
That’s not the case. There are few things you can predict with confidence in financial markets, but that the May 2017 Treasury bond will mature at exactly $100 is certain. The following chart, courtesy of Bloomberg, shows the full history of the price of the May 2017 Treasury bond since its issue in 1987.
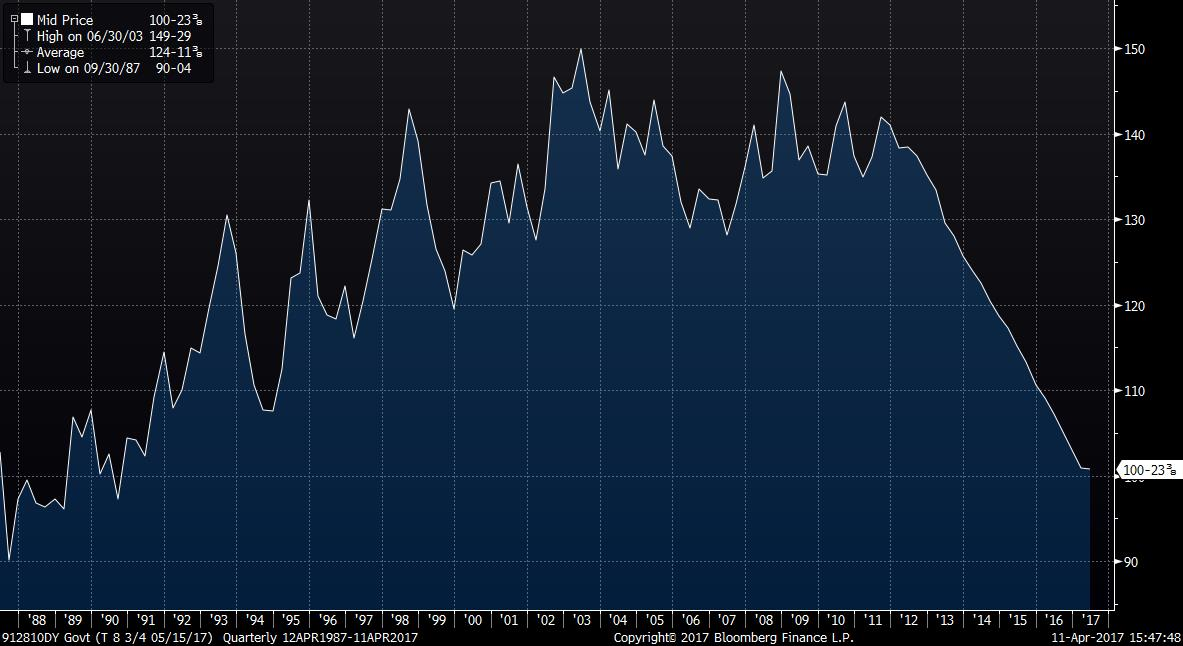
The price of this bond did increase early in its life, peaking at just under $150 value in 2003. So, you could say that there was a bull market over its first 16 years, albeit with some rather large ‘corrections’ in 1994 and 1999. There was then a clear bear market from 2003 to 2006 and overall the period from 1998 until 2012 looks more like a range trade in the $130-145 region. Since 2011 the bond’s price has been in rapid descent to the current level of just under $101. The remaining $1 above par will be discarded by the market over the next couple of weeks and it will pay holders at maturity the same $100 at which it was issued 30 years ago.
Since the definition of a bull market is a persistent increase in asset prices, the May 2017 US Treasury bond has not been in one for at least the past 14 years. This is especially so if you consider real, or inflation-adjusted prices. $100 is not worth as much in 2017 as it was back in 1987. Furthermore, the same could be said of every bond that has matured during the last 10, 20 or 30 years. They’ve all matured at par value. Not one bond has paid investors an inflated price. If that’s a bull, then I wouldn’t bother entering it in the Royal Easter Show!
More subdued over time
Now, let’s combine the trend in yields and prices to the history of bond market returns since the early 1980s. What we find is that the years of great returns are front loaded. There was a bull market in bonds at one time, but it was in the early years of this 30-year period. Since then, returns have been more subdued over time:
- During the mid to late 1980s, rolling five-year returns from the US Treasury market were often above 15% pa and always in double digits.
- By the 1990s, things had changed and returns were running in the 7.5–10% region.
- Since the late 1990s, rolling five-year bond returns have been closer to 5% pa and, over the past half dozen years or so, investors have received in the region of 2-3% pa.
Astute readers will compare these return outcomes with the 10-year yield chart and notice something remarkable. When yields were high, so were returns! However, as yields declined, although initially this gave a boost to total returns, ultimately it resulted in lower returns.
Does that sound like a long-term bull market? Owners of bonds have made good returns in the past 30 to 36 years. But it’s been from the yields they’ve been paid, not from any long-lasting capital price appreciation.
What next for bond returns?
The long-run trend in declining yields appears to have ended about five years ago. Since then we’ve had two small ‘bear markets’, during the taper tantrum in 2013 and in response to stronger growth expectations in 2016. The latter has petered out, with Treasury yields back to the low end of their post-election range.
But what if we are in for a period of rising bond yields? If that happens, then investors with long-duration investments will experience potentially significant negative returns for a time. However, a sustained rise in bond yields will gradually result in rising bond returns in exactly the same way as the historical trend has been for falling yields to gradually reduce returns.
And along the way, whatever bond prices do in 2017 or any other year, every bond will pay back its par value at maturity (assuming no defaults). Never let the scaremongers divert your thinking from the simple mathematical reality of how bond markets behave.
Warren Bird is Executive Director of Uniting Financial Services, a division of the Uniting Church (NSW & ACT). He has 30 years’ experience in fixed income investing. He also serves as an Independent Member of the GESB Investment Committee.