The Weekend Edition includes a market update plus Morningstar adds links to two additional articles.
The S&P 500 is on pace for back-to-back years with total returns of more than 20%. The last time that happened? 1998-1999.
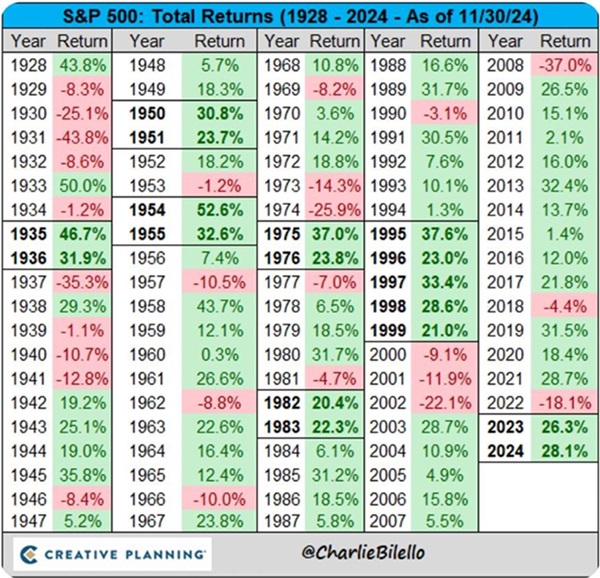
This statistic alone is intriguing, though doesn’t tell a lot. After all, the S&P 500 had five successive years of +20% returns before the dot-com bubble burst in 2000.
The US market also did well prior to Covid, with three years of +18% returns in a row.
Good years aren’t necessarily followed by bad years, and vice versa. The future isn’t that easy to predict!
Longer-term charts often give us a fuller picture, and this one is a beauty.
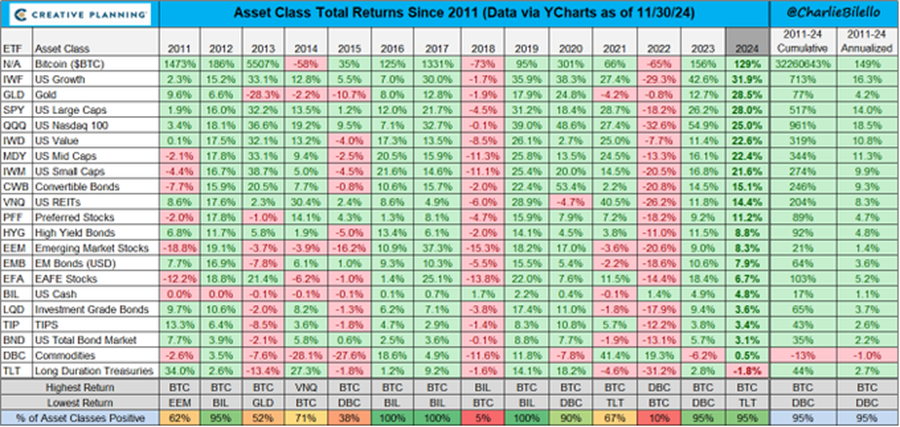
The chart shows it isn’t just US equities that have performed well. Every asset class is up, except long-duration US Treasuries. Bitcoin has again led the pack, rising 129% year-to-date. Gold has also been a big winner, increasing 29%, despite the strength of the US dollar.
Outside of this, US stocks have been the standout performer. Growth stocks have led the way, rising 32%, following by large caps up 28%, and the Nasdaq that’s 25% better off. US small and mid-caps lagged in the first half but have played catchup since.
And what about the asset classes that haven’t done as well? Stocks outside America fall into this category, whether it’s emerging markets or EAFE (Europe, Australasia, and the Far East).
Bonds have trailed most other assets for a fourth year in a row.
Commodities have also had a poor year, after an even worse 2023.
Now, let’s turn our attention to the far right column of the chart - it shows the annualised return of each asset class over the past 14 years.
Even on this basis, Bitcoin’s returns remain otherworldly.
US stocks also look healthy. Growth stocks have increased 16% per annum, large caps 14%, and the Nasdaq 19%.
Given that the S&P 500 has an annualized return of close to 10% over its history, you can see that the past 14 years have been an exceptional period for US equities. It’s also not hard to see that at some point, this performance could mean revert at some point. It’s probably part of the reason that Goldman Sachs has forecast the S&P 500 to have an annualized return of 3% over the next decade.
On the flip side, bonds and cash have had a terrible time of it over the past 14 years. And commodities are down from 2011 levels.
Can US exceptionalism continue?
As a result if the strong US performance, international stock indices are now dominated by America.
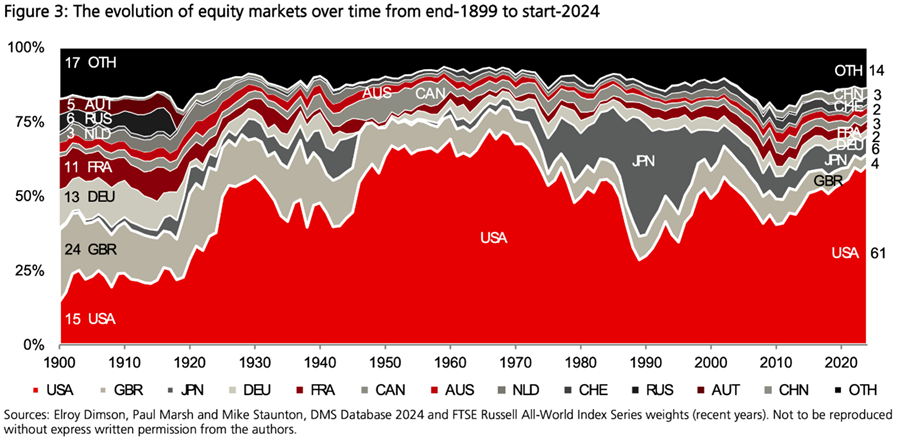
This chart is from the start of 2024, and the US is now close to 65% of the world stock index. These levels were last seen in the late 1960s/early 1970s, when the US was at the peak of its powers versus the rest of the world.
The US then had a precipitous drop until the late 1980s, before it’s extraordinary run over the past 35 years.
Fund managers and individuals are very bullish on US prospects.
The rolling 12-month average of AAII’s bull/bear sentiment spread of individual investors is at its highest level since 2005.
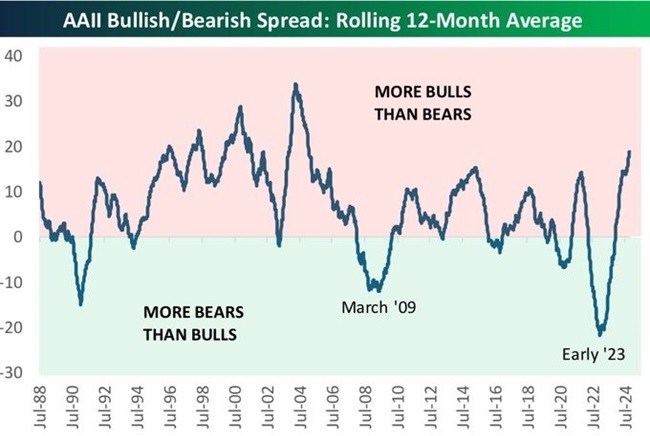
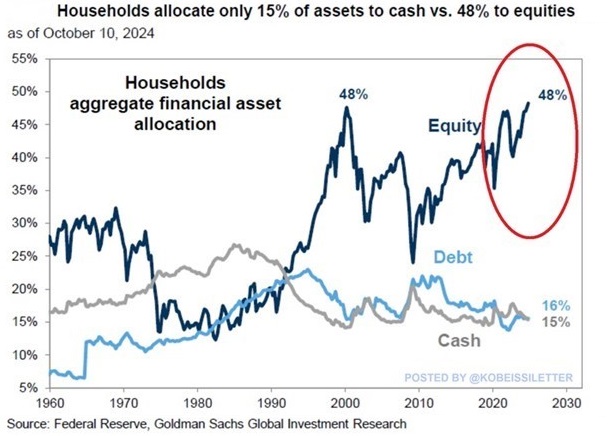
US households have now allocated a record-equalling 48% of their assets to stocks.
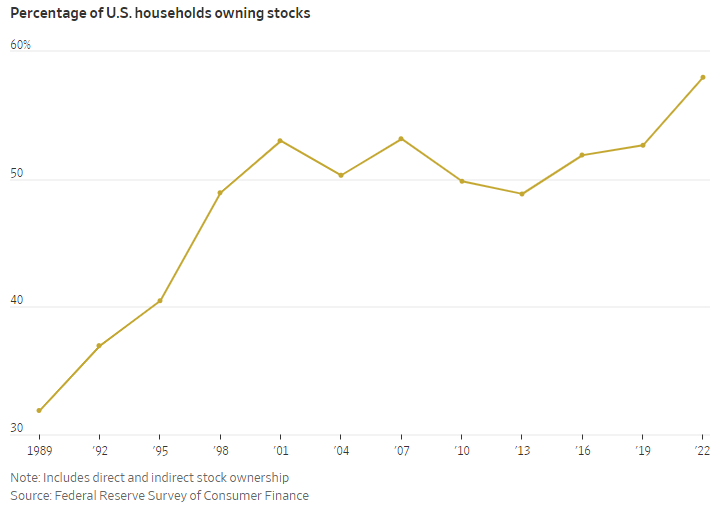
And the percentage of US households owning stocks has reached all-time highs.
The optimism is reflected in US market valuations. The S&P 500 is trading at 22x earnings, compared to the median of 15.4x and average of 15.9x since 1990.
Positive sentiment towards the US market has spilled over into signs of frothiness. Bitcoin and related entities have rocketed since Trump’s election, as has other stocks favoured by speculators, like Tesla.
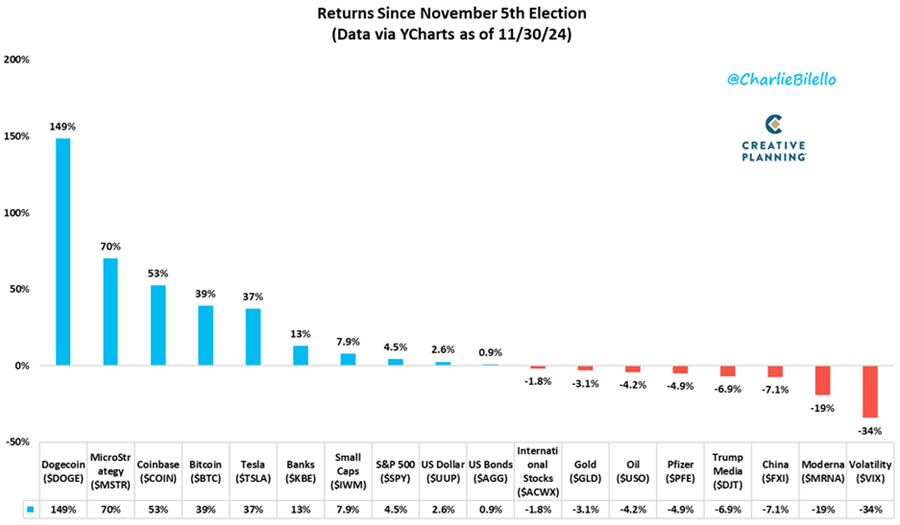
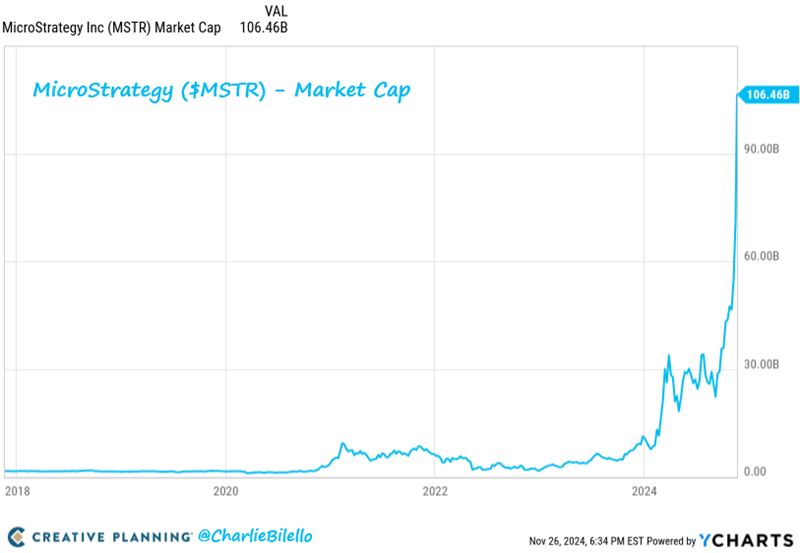
The stock, MicroStrategy, is a case in point. Its primary business is essentially buying Bitcoin, and at its recent peak, it had a market capitalization of more than US100 billion. What’s interesting is that at this valuation, it was almost 3x higher than the value of its Bitcoin holdings. And the MicroStrategy’s 7-year return of 3,420% exceeds even that of Nvidia.
There are other signs of excess. Recently, China-born cryptocurrency entrepreneur, Justin Sun, made headlines when he paid $US6.2 million for a conceptual art piece called Comedian, which consists of a banana attached to a white wall with duct tape. A few days later, he ate the banana at a press conference in Hong Kong!
Looking elsewhere for ideas
If the US market is looking toppy, where else can investors put their money? Stocks outside of America may be worth considering. Japan looks appetising given it has many world-class companies with inexpensive valuations and corporate reform that’s still playing out. India also boasts many great companies though it’s looking expensive right now and could be considered on dips.
Unfortunately, much of the ASX appears overvalued too. The rise in bank shares has been incredible and detached from fundamentals. On the other hand, many commodity stocks have been left for dead and that’s where value may lay. Oil majors like Woodside (ASX:WPL) and Santos (ASX:STO) appear cheap at these levels.
In addition, there may be value in best-in-class businesses that are being dragged down by sector-wide issues. For instance, the stand-off between hospitals and health insurers over hospital funding is weighing on the share prices of companies in this space. That potentially offers an opportunity in companies with great track records like Medibank Private (ASX:MPL).
Finally, people often ask about bonds after their recent underperformance. For me, bond cycles tend to be drawn out over 30-40 years, and we are year four into this current bear market. If history is any guide, bonds may have rallies, but they’re best sold rather than bought. I prefer putting money into fixed-term deposits, which are offering attractive real returns with yields well above the rate of inflation.
----
Super funds have been battered in the press of late. My article this week adds (inadvertently) to the pile-on. I suggest that while the performance of the largest super funds has been admirable, they’ve become so big that it will make it difficult for them to outperform their benchmarks in future. It’s something that isn’t widely discussed but should be.
James Gruber
Also in this week's edition...
The world and Australia’s retirement landscape have changed a lot since 2020, and Kaye Fallick thinks that if the Retirement Income Covenant is to achieve its goals, a wider spread of responsibility and a rethink across all five pillars of retirement planning are needed.
To give you an idea of how much you will need to live on in retirement, the Association of Superannuation Funds Australia provides the ASFA Retirement Standard. Pascele Helyar-Morey says that the standard doesn’t reflect reality, especially for women. She says more needs to be done to address the growing gap in superannuation balances between men and women.
Investors have cheered Donald Trump’s focus on deregulation and for the federal government to play a smaller role in the economy and financial markets. Robert Almeida from MFS says that investors may not have fully thought through the implications of this policy. He says it will impact business profitability, which could dampen the market’s enthusiasm.
The market share of ETFs and index trackers keeps rising and with it concerns about reduced market efficiency. Joachim Klement says some of these concerns are valid, though he doubts we've seen 'peak ETF' and there doesn't seem to much that active managers can do about it.
Any discussion on annuities needs to address the credit risk associated with relying on the solvency of a single insurer. David Orford and colleagues offer a helpful guide on the regulation of annuities and the best ways to assess solvency risk.
Can a crime invalidate a will? A lot depends on the nature of the crime, says Nick McColl.
Two extra stories from Morningstar this weekend. Simonelle Mody explores an ASX pick that goes against the grain, while Joseph Taylor highlights a hated yet compelling income play.
Lastly, in this week’s whitepaper, RQI Investors – part of First Sentier – takes a deep dive into profitability and why it’s a useful measure for investors and might be persistent through time.
****
Weekend market update
The S&P 500 and Nasdaq Composite rallied to set new records after data showed hiring rebounded in November. The latest nonfarm payrolls report suggested the labor market remains in decent health—but not strong enough to deter the Federal Reserve from cutting rates later this month. A total of 227,000 positions were created in November, topping expectations. Unemployment edged up to 4.2%, matching consensus forecasts. The S&P 500 ended up 0.3% and the Nasdaq was 0.8% higher. Ten year bond yields fell 3bps to 4.15%. Bitcoin stayed close to US$100,000.
From AAP Netdesk:
The local share market on Friday finished lower for both the day and the week. The benchmark S&P/ASX200 index on Friday dropped 54 points, or 0.64%, to 8,420.9 while the broader All Ordinaries fell 55.2 points, or 0.63%, to 8,689.3. The ASX200 lost 15 points, or 0.18%, for the week, snapping its two-week winning streak despite setting a record high on Tuesday.
Ten of the ASX's 11 sectors finished lower on Friday, with utilities the only gainer.
Energy was the biggest loser, dropping 1.2% as Woodside fell 2.2% and Santos dropped 1.2%.
In the heavyweight mining sector, BHP rose 0.3% to $40.70, Fortescue dropped 1.1% to $19.49 and Rio Tinto fell 0.8% to $119.78.
The big four banks all lost ground, with Westpac dropping 1.4% to $32.76, CBA falling 0.6% to $157.06, NAB losing 0.4% to $38.80 and ANZ dipping 0.1% to $31.15.
In utilities, APA Group rose 1.4% to an almost two-month high of $7.27 after the Australian Energy regulator confirmed the pipeline operator's South West Queensland Pipeline would not be subject to full price regulation. APA chief executive and managing director Adam Weston said the decision gave APA the confidence to continue making investments to help meet gas demand on the east coast and it would move at pace to add capacity.
Looking ahead, the Reserve Bank will meet to announce its latest decision on interest rates on Tuesday afternoon, with the central bank expected to leave rates on hold for the 13th month in a row.
In the US, consumer price index data for November will be released on Wednesday.
From Shane Oliver, AMP:
Despite another week of geopolitical noise with the “fall” of the French Government, a few hours of martial law in South Korea and more noise around Trump, global share markets rose helped by solid US economic data and ongoing expectations for rate cuts globally. For the week US shares rose 1% helped on Friday by benign jobs data supporting the case for a December Fed rate cut. Eurozone shares rose 2.9%, Japanese shares rose 2.3% and Chinese shares rose 1.4%. Despite the political noise, French shares actually rose 2.7% as the no-confidence vote in the French Government was not surprising and South Korean shares only fell 1.2%. Notwithstanding the positive global lead, the Australian share market fell 0.2% with weaker than expected economic growth only partly offset by increased prospects for an earlier rate cut with gains in retail and IT shares but falls in property and utility shares. Bond yields generally fell, including in France. Oil prices fell despite OPEC delaying a production increase until April in the face of rising US supply and weak Chinese demand for oil. Metal and iron ore prices rose but gold prices fell. The $A fell on prospects for earlier rate cuts and the $US rose slightly.
Dismal Australian economic growth. While the September quarter GDP data was not all bad as it did show a lift in household income and savings potentially supporting a future pick up in consumer spending, it was mostly pretty dismal: growth came in softer than expected at just 0.3%qoq; annual growth slowed to 0.8%yoy its slowest outside the pandemic since the early 1990s recession; consumers largely saved their tax cuts resulting in flat consumer spending after a 0.1%qoq fall in the June quarter; and the “per capita recession” continued with GDP per person down in 8 of the last 9 quarters. Were it not for strong growth in public demand and strong population growth Australia would be in recession as the former is partly offsetting the near recessionary conditions in private spending and the latter is keeping the economy growing despite the fall in GDP per person. However, there are three big problems with this:
- Firstly, the fall in per capita GDP is an indicator of falling living standards per person in Australia. Strong population growth has covered this up in terms of traditional GDP but it doesn’t drive higher living standards per person in the short term and we can’t rely on strong population growth to keep the economy going as its caused an undersupply of housing and both sides of politics are now looking to slow it down to more sustainable levels.
- Second, the surge in public spending to a now record 28% of GDP has made the RBA’s job in controlling inflation harder because it’s kept demand in the economy higher than otherwise would have been the case which has meant that interest rates have had to stay higher for longer to slow demand, and hence inflation, which in turn has meant that private spending has had to be squeezed by more than would otherwise have been the case. Households have paid for this by having to cut back their discretionary spending. In other words, were it not for the surge in public spending inflation would now likely be lower and so too would the RBA’s cash rate. So all the public spending has made things tougher for mortgage holders.
- Finally, the surge in public spending is exacerbating Australia’s productivity slump with productivity down another 0.8% over the last year as private market sector productivity is invariably higher than public sector productivity and as public spending squeezes out private business investment it is likely exacerbating the weakness in private market sector productivity. And weak productivity growth makes it harder to get inflation down and will depress long term growth in per capita GDP and hence in living standards. See next chart.
Curated by James Gruber and Leisa Bell
A full PDF version of this week’s newsletter articles will be loaded into this editorial on our website by midday.
Latest updates
PDF version of Firstlinks Newsletter
ASX Listed Bond and Hybrid rate sheet from NAB/nabtrade
Listed Investment Company (LIC) Indicative NTA Report from Bell Potter
Plus updates and announcements on the Sponsor Noticeboard on our website