Like many of you reading this, my savings have taken a hit since February. I know we always say that investing in the stock market is for the long term, but that doesn’t make holding your nerve through this any easier.
Every time there is a major downturn, it feels like we are drowning. When will the storm end? When will we be able to catch our breath? Where is the dry land? Importantly, how we respond to these downturns can have a big impact on our future wealth.
Risk of loss is the price of the entry ticket for the stock market
The unfortunate truth is that stock market declines of the recent magnitude, and worse, occur from time to time. Volatility and the risk of loss are part of the ‘price of the entry ticket’ for stock market investments.
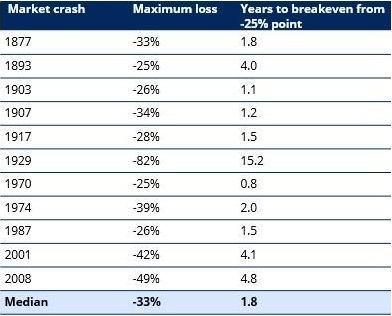
There have been 11 occasions in the 148 years between 1871 and 2019 when stocks (as measured by the S&P 500 Index) have destroyed at least 25% of value for investors (see table). In the 2001 and 2008 downturns, losses exceeded 40%.
In the worst case, the Great Depression of the 1930s, investors lost over 80% of their money. It took over 15 years for them to make their money back if they remained invested.
Other stock market falls were not quite so calamitous. In seven of the 11 episodes, investors would have recouped all losses in two years or less if invested in the S&P500 index. In 1893, 2001 and 2008, the period to breakeven was four to five years.
How long did US stocks take to recover losses from a 25% crash?
Past Performance is not a guide to future performance and may not be repeated.
Source: Robert Shiller, Schroders. Monthly data 1871-2020. Data is for S&P 500 and assumes investors retained their exposure to the stock market.
These figures are all in nominal terms, so they include any uplift that may have come from inflation. The numbers look worse in inflation-adjusted terms. For example, although the US market had made up its dotcom losses by October 2006 in nominal terms, it was not until April 2013 that it broke even in inflation-adjusted terms.
On the flip side, over the last 148 years and two months, US stocks have returned an amazing 8.9% a year, 6.7% a year ahead of inflation. Over the same period, US cash returned only 4% a year.
Dash for cash, stick with stocks, or double-down?
There are three common investor responses to a market crash:
· Dash-for-cash: abandon the stock market in favour of the perceived safety of cash
· Stick-with-stocks: the 'do nothing' approach
· Double-down: invest additional money in the stock market, either as a lump-sum or by drip-feeding money in.
Lump-sum investing exposes investors to the risk that they make the investment at a bad time, adding the challenge of picking exactly the right time. It also assumes that investors can access a large cash pile to finance that investment.
In contrast, the drip-feeding approach is a bit like 'buying low' but with the humility to accept that we have no idea when the lows will occur. 'Buying lower than before' might be a better description.
In the remainder of this article, we assume this is the approach taken in the double-down response.
Why alternative responses matter
In the 11 previous falls of 25% or more, investors were in the position that many find themselves in today.
For the purpose of this analysis, in the double-down response, we have assumed that an individual invests an annual amount equivalent to 5% of the portfolio's value in the month when the market first declines by at least 25%.
So, for a portfolio worth $10,000 which had fallen in value by exactly 25%, the monthly investment would be 5% x 7,500 / 12 = $31.25 per month. This is equivalent to just over 0.3% of the pre-crash value of the portfolio. This would not be an unrealistic amount for many investors and can easily be scaled up or down for different amounts. These figures are for illustrative purposes only and are not a recommendation.
It follows that investing new money will increase a portfolio’s value faster than doing nothing. We then calculate the length of time to get back to the pre-crash level plus the value of additional investments. In the table below, the 'stick-with-stocks' results are the same as those shown earlier.
Number of years before all losses are recouped
Source: Federal Reserve Bank of St. Louis, Robert Shiller, Schroders. Stock market data is for S&P 500. Monthly cash return 1934-2020 based on 3-month Treasury bill, secondary market rate; 1920-1934 based on yields on short-term United States securities; 1871-1920 based on 1-year interest rate. 1871-1920 data only available annually so a constant return on cash has been assumed for all months during this period. Other data is monthly. All analysis is based on nominal amounts.
There is a real risk that individuals are so scarred by recent experience that they are put off from investing in the stock market for a long period of time. They dash for cash. However, our research shows that historically, that would have been the worst financial decision an investor could have made. It pretty much guarantees that it would take a very long time to recoup losses.
For example, investors who shifted to cash in 1929, after the first 25% fall of the Great Depression, would have had to wait until 1963 to get back to breakeven. This compares with breakeven in early 1945 if they had remained invested in the stock market. And remember, the stock market ultimately fell over 80% during this crash. So, shifting to cash might have avoided the worst of those losses during the crash, but still came out as by far the worst long-term strategy.
The message is overwhelmingly clear: a rejection of the stock market in favour of cash would have been very bad for wealth over the long run.
Should investors buy more?
This is a very personal question. Irrespective of any investment considerations, not everyone will be able to buy more, whether they want to or not. Alongside the significant health consequences of Covid-19, people are suffering job insecurity and cash flow difficulties. The need to pay rent and bills, to buy food, to feel financially secure, trumps any opinions about whether the stock market is good value or not.
All comments which follow must be taken with that caveat in mind. That is in addition to the caveat that it remains very difficult to quantify how bad things will get during the current downturn.
However, at least in regard to that second caveat, that is no different to any previous market crash. Do you think investors knew in 1929, after the first 25% fall, that the stock market was going to fall another 75%? Or that in 1893, 1903, 1917, 1970, or 1987, they knew that -25% was close to the low point?
Our analysis finds that, in most cases, the double-down response would not have made a huge difference to the length of time needed to recover losses compared with doing nothing. It shortens the recovery period in six cases, makes no difference in four and results in a worse outcome in one.
However, the one time that it made a big difference was in the worst downturn of all, the Great Depression. Then, drip-feeding a small amount into the stock market would have cut the length of time to recovery by more than half—6.7 years compared with 15.2 years.
Although it may seem surprising that the double-down strategy does not make a bigger difference, this is partly because the assumed size of the investment is relatively low. Investing an amount equivalent to 20% of the portfolio value, rather than 5%, would have closed the gap quicker in each case.
Actions have consequences
Everyone’s circumstances are different, and this is in no way intended as financial advice. Nonetheless, for those who are already invested in the stock market, the steps you take now will have an impact on how your portfolio recovers from the current downturn. Anyone thinking of moving to cash should consider the consequences, with savings rates at close to zero.
In contrast, history shows that investors who hold their nerve are likely to end up with a better long-run outcome. Those who are in a position to be able to add to portfolios could end up even better off and are unlikely to end up worse off.
However, this only holds in the long run. No one has a crystal ball to be able to predict how and when the current downturn will end. Repeating what I wrote earlier, risk of loss is the price of the entry ticket for the stock market. Higher long-term returns are the potential payoff. The mental scars of what we are living through will be with us for a generation, but the financial scars need not be.
Duncan Lamont is Head of Research and Analytics at Schroder Investment Management Australia. This material is general information only and does not take into account your objectives, financial situation or needs. Schroders does not give any warranty as to the accuracy, reliability or completeness of information which is contained in this material.