In part 1, we compared real total returns from shares from the point of view of two different investors: an Australian investor in the broad Australian market in Australian dollars after Australian inflation, versus an American investor in the broad American market in American dollars after American inflation. The ‘return on investment’ (ROI) from both markets was around the same at 6.6% in real terms when averaged over 115 years. However, returns in the two countries did vary considerably along the way, with Australia and the US taking turns in having larger booms and bust cycles.
Australians investing in US shares
In part 2, we take the point of view of just the Australian investor and ask: “What would the returns from the American market have been to an Australian investor - ie converted back to Australian dollars and after Australian inflation?”
This question now involves two additional elements: changes in exchange rates between the currencies of Australia and the US (because the US returns are translated back into Australian dollars for the Australian investor to spend here), and also differences in CPI inflation rates (because the Australian investor’s real spending power is determined by Australian inflation, not US inflation).
The answer to the question is: Returns from the broad US stock market to Australian investors was still the same as returns from the broad Australian stockmarket – even though the exchange rate changed over the period, and inflation rates were different in each country. Of course, returns will differ depending on the particular start and end dates to use and the choice of index, but the broad outcomes are similar.”
Same outcome, different pattern
At first glance, this chart looks similar to the chart in part 1 [Click to enlarge]. The end points are virtually the same and the timing of booms and busts are more or less the same in both markets.
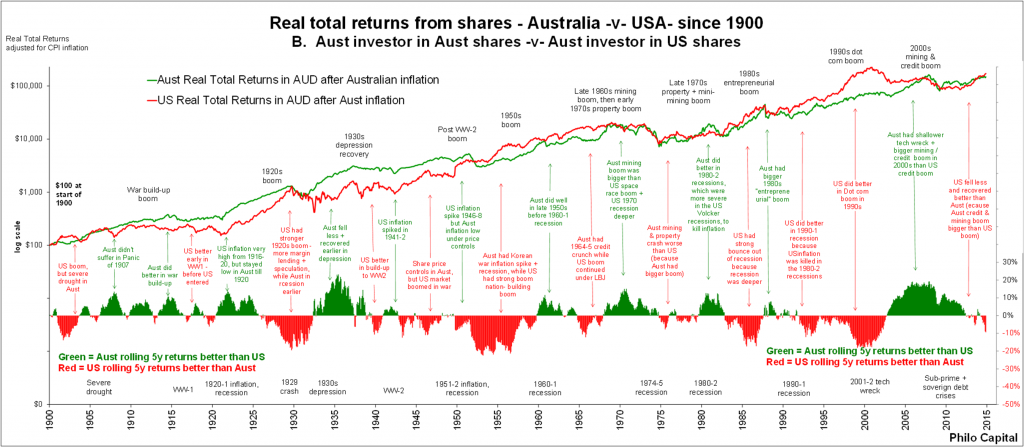
Where the charts differ is that the magnitude of each boom and bust cycle in each country is different due to changes in exchange rates and differences in inflation rates over time. Although both markets boom and bust together, the US portfolio (converted to AUD terms) does better during periods when the AUD was falling against the USD, for example:
- US market returns in AUD were better in the early 1930s depression, because Australia devalued earlier and further than the US
- US market returns in AUD were better in the late 1930s, as the Australian pound depreciated
- During the mid-1970s to mid-1980s, because the AUD fell steeply against the US dollar despite the USD weakness following Nixon's breaking of the gold standard
- During the 1990s dot com boom because the AUD fell with the commodities price slump.
Currency gain
Astute readers will observe that since the Australian dollar has fallen by two thirds in value against the USD over this period, this would have generated a currency gain to Australian investors, and this should have nearly trebled their money on their US shares converted to Australian dollars. This means that Australian investors would have been much better off investing in US shares instead of Australian shares. Is this true?
The answer is ‘yes and no’. Yes, the AUD did decline against the USD by 64%, from USD1.416 per AUD in 1900 (actually USD1.208 per £1 Australian pound), down to just USD0.88 at the end of October 2014, and that generated a currency gain of 174%, or 0.88% pa over the period.
But this currency gain to Australian investors was neutralised by the higher inflation rate in Australia. Australian investors must apply the higher Australian inflation rate to the nominal returns on the US portfolio, and Australian inflation was nearly 1% higher than US inflation. This neutralises the 1% pa gain on the currency.
The way changes in exchange rates and inflation rates impact returns to investors is shown below. The upper panel shows returns from US shares for US investors (in US dollars after US inflation), and the lower panel shows US returns translated into Australian dollars after Australian inflation.
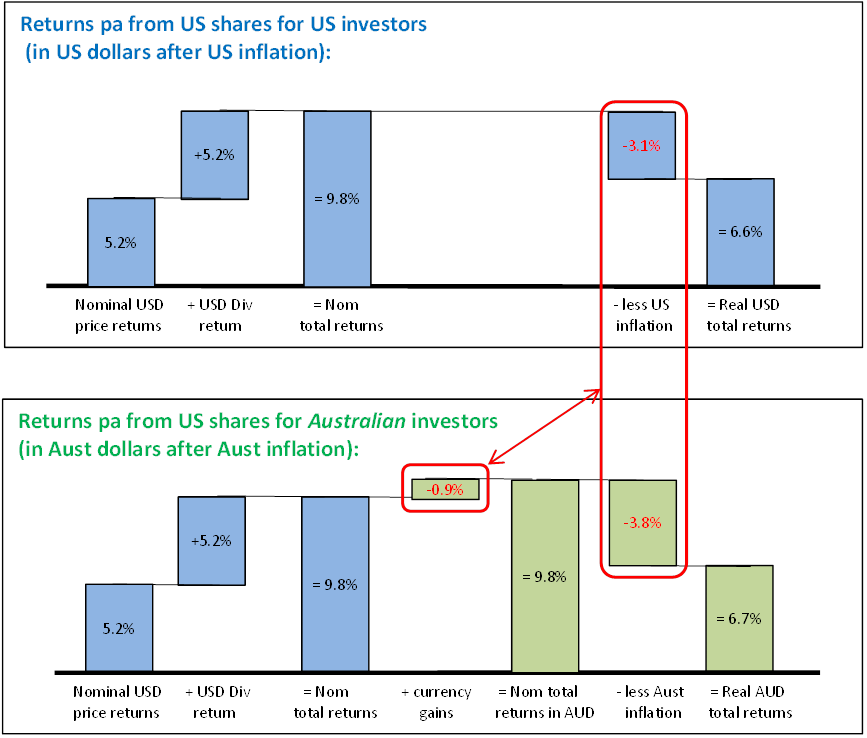
Returns from both markets for Australian investors have been around the same at about 6.6% to 6.7%, the difference is not statistically significant.
Currency gain/loss is the same as differences in inflation over long periods
This is a neat real life illustration of one of the principles of international finance at work: that over very long periods of time, changes in exchange rates between two countries tend to reflect differences in inflation rates.
There is no magic in this, because exchange rates and inflation rates are simply two sides of the same coin. They are merely two different ways of expressing the same thing – the real buying power of a country’s currency.
For example if the Australian government suddenly decided overnight to double the amount of money in the Australian economy, two things would occur tomorrow: first, the AUD price of everything in Australia would double (resulting in the CPI index doubling). In other words the real spending power of an Australian dollar would drop 50% in terms of what it could buy in Australia. It would take two new dollars to buy a banana that cost one old dollar yesterday because everybody has twice as much money to spend but the supply of bananas has not changed.
The second thing that would happen is the Australian dollar would drop by 50% against other currencies because it would now take two new Australian dollars to buy the currencies of other countries that one old dollar could buy yesterday.
This has actually been done by governments throughout history, with precisely those outcomes, as explained here. The US, UK and Japanese central banks are currently furiously printing money with the specific aims of increasing their domestic inflation and lowering their exchange rates relative to other currencies. The European Central Bank is about to join in the party. (The currency depreciation effect is not working today of course because exchange rates are a relative game – it does not work if the other countries are all printing money at the same time.)
Long term decline of the Australian currency
The Australian currency has depreciated by nearly 1% per year against the US dollar over the past century, as Australia’s inflation rate has been nearly 1% higher than US inflation. They are merely reflecting the declining real purchasing power of the Australian currency.
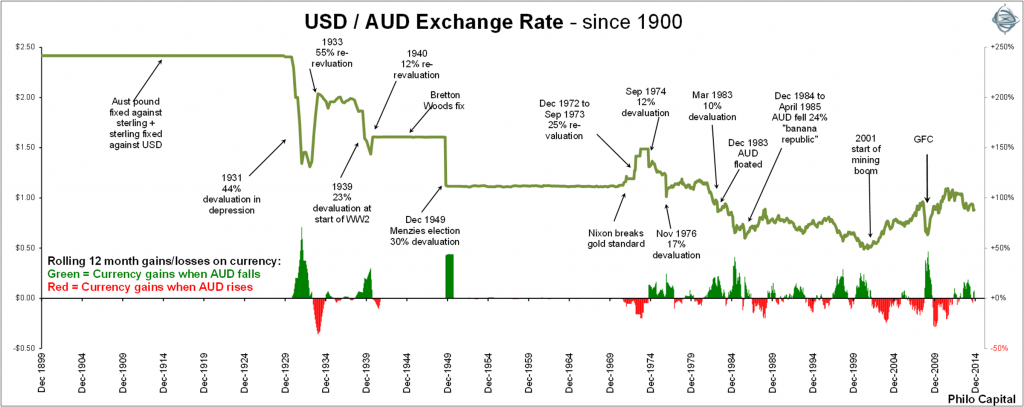
This relationship between exchange rates and relative inflation rates has also been the case with other countries as well. For example the UK pound /AUD exchange rate is still virtually the same as it was in 1900 (£0.50 GBP per AUD in 1900 and £0.54 GBP per AUD now), as average inflation rates have been virtually the same in both countries over the period.
The Japanese Yen has lost 95% of its value against the AUD (from 4.82 yen per AUD in 1900 to 100 yen per AUD now) which is an average fall of 2.6% pa. Correspondingly, Japanese inflation over the period averaged nearly 3% higher than Australian inflation over the century, including the hyperinflation in 1945-8 when Japanese prices inflated by 5,500% and the yen lost 99% of its value. So the relationship between exchange rates and relative inflation rates still operates through massive economic upheavals, world wars, hyper-inflation, deflation, depressions and even almost total national destruction.
Hedged or unhedged?
Because over very long periods the exchange rates between two countries tends to mirror the differences in their inflation rates, for very long term investors the returns tend to be very similar whether the currencies are hedged or unhedged. All currency hedging does is release the currency gains or losses in the form of regular instalments (based on differences in short term interest rates in the two countries) rather than wait for the currency to fall (or rise) to deliver the currency gains (or losses) - and line the pockets of investment bankers!
However, because currencies can and often do remain overvalued or undervalued for many years at a time before snapping back, hedged returns can be significantly higher or lower than unhedged returns for periods of up to several years. For most short term or medium term investors, the decision of whether or not or when to hedge the currency can make a significant difference to returns. For example, for Australian investors in foreign shares:
- Hedged returns were much higher than unhedged returns during the 2003-7 mining boom as the AUD rose
- Unhedged returns were much higher than unhedged in the second half of 2008 as the AUD collapsed
- Hedged returns were much higher than unhedged in 2009 when the AUD rebounded.
Hedged and unhedged portfolios also generate significantly different volatilities, different correlations with other assets in portfolios, and different diversification benefits. The issue of whether or not to hedge is complex and will be covered in separate articles.
Ashley Owen is Joint CEO of Philo Capital Advisers and a director and adviser to the Third Link Growth Fund. This article is for general educational purposes and is not personal financial advice.