The 2025 footy season has been run and won across the codes, with the Brisbane Lions going back-to-back in a quirky AFL finals series, and the Brisbane Broncos finally ending Penrith’s four-year stranglehold in the NRL. Clearly it was Brisbane’s year.
Last year I looked at how the pre-finals bye in the AFL was disrupting top-4 sides, and this year I take a deeper dive into the numbers to reveal an even clearer trend.
But first. This year’s AFL finals saw for the first time ever, the eighth-placed team knock out the minor premiers. And in the process of losing to Hawthorn in a semi-final, Adelaide became the first minor-premier since 1983 to be eliminated from the finals in straight sets.
Incredibly, the NRL minor premiers Canberra, also went out in straight sets. The first time ever that both AFL and NRL minor premiers suffered this fate in the same year.
And for the sixth time since the current AFL final-eight format commenced in 2000, the grand final featured teams that had played off against each other in a week one qualifying final. On five of those six occasions, including this year, the loser of the qualifying final flipped the result to win the grand final. This year, Geelong beat Brisbane in the second qualifying final, only to have that result reversed three weeks later in the final decider.
In my article last year, I argued that the momentum sapping pre-finals bye introduced in 2016 had tilted the finals balance away from teams 1-to-4, evidenced by the increased frequency of so-called ‘straight-sets’ finals exits among the top-4 teams, and their increased frequency of preliminary final losses after winning the week-1 qualifying final.
This year, I’ve taken the analysis beyond exit outcomes to more tangible measures such as win counts, win ratios, and end results for teams 1-to-4 versus 5-to-8. I’ve also quantified the structural advantage built into the finals system for top-4 teams, providing a baseline against which actual finals wins can be measured.
This baseline measure compares average expected wins for the top-4 in a finals series, compared to expected wins for teams 5-to-8 (see the footnote for the calculations).
The baseline calculation assumes a probability of winning any final by any team of 50%. An assumed 50:50 proposition in each game removes all real-world characteristics such as team form, injuries, and home ground advantage, thereby neutralising the chances of any team winning an individual final. Across a complete finals series however, a winning buffer still emerges for top-4 sides, solely due to the finals structure that affords a double chance to those sides.
The calculation reveals that a top-4 team can expect to win 1.40 times more finals than 5-to-8 teams. This baseline, structural win ratio can then be compared to observed win ratios.
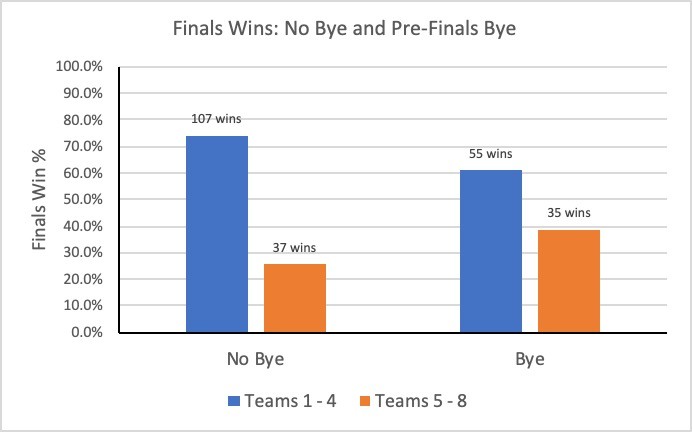
In the pre-bye period of 2000-2015, top-4 teams recorded 107 finals wins across the 16 seasons, against 37 wins for 5-to-8 teams. That is, an observed top-4 to lower-4 win ratio of 2.89.
And for the bye period 2016-2025, the ratio was 55 top-4 wins to 35 lower-4 wins = 1.57.
A win ratio of 2.89 compared to the structural advantage only ratio of 1.40, suggests that top-4 teams won far more games in the pre-bye period, than the finals format alone would predict. This represents significant non-structural advantages at play for the top-4 sides, in addition to the advantage reflected in the double chance.
The bye period ratio of 1.57 is however, close to the 1.40 baseline and is surprisingly low, reflecting a far reduced non-structural edge in the era of a pre-finals bye.
The difference in observed win ratios is stark. A drop from 2.89 to 1.57, is about a two-thirds fall in the buffer the top-4 teams had over 5-to-8. A caveat: the differing sample sizes (144 finals pre-bye vs 90 bye) mean random variation plays a role, but it can’t fully explain the large gap.
While the introduction of the pre-finals bye aligns with the drop in the top-4 winning ratio, it’s unlikely the bye alone explains such a sharp fall. But it may have accelerated the trend in levelling the playing field along with evolving equalisation factors in player drafts, salary caps, player academies and the like.
And while a winning ratio of 2.89 pre-bye seems high for the top teams, 1.57 now seems low, such that maybe the bye has swung the pendulum too far. It is a situation left for the AFL to ponder.
In probability terms, a 50% chance of any team beating another yields the baseline win ratio of 1.40. Working backwards, the pre-bye ratio of 2.89 implies an effective win probability of about 80% for top-4 teams over lower-4, while the bye ratio of 1.57 implies about 55%. Note, the calculation involves multiple conditional probability paths, and the maths isn’t shown here.
So again, 80% seems high and 55% low. With 55% barely above the baseline, the top teams’ non-structural winning buffer has almost all been eroded in the bye period.
Note that these probabilities are useful for looking at relativities, but in reality, probabilities within individual games will jump around considerably. However with these relativities, the overall conclusion remains the same.
Other observations out of the win counts over the two periods include:
- The win rate for teams 5-to-8 jumped from 36.7% in the pre-bye era (37 wins from 101 finals) to 48.0% in the bye era (35 wins from 73 finals).
- Top-4 teams in the pre-bye era won all 16 premierships, filled all 32 grand final slots, and 59 of the 64 preliminary final slots (there are two preliminary finals per year).
- In the era of the bye, top-4 teams won eight of the ten premierships, filled 16 of the 20 grand final slots, and 31 of the 40 preliminary final slots.
Clearly, teams 5-to-8 have gone from just making up finals numbers in the pre-bye era, to now winning nearly half their finals, including making the grand final and occasionally winning it. And if the bottom-half teams have now become a reasonable premiership threat, the question remains is that a good thing, or has the reward for making the top-4 in a tough competition been eroded too much? It’s all about getting the balance right.
Footnote
We can show the mathematical advantage the top-4 finalists (teams 1-to-4) have over the lower-4 (teams 5-to-8), with the top-4 able to lose in week 1 and not be eliminated, while every game is sudden death for the lower-4.
Assume each of the 8 teams has a 50% chance of winning a final across the nine games in a given finals series. With this assumption, we will derive the advantage for the top-4 sides purely from the finals structure, reflecting the double chance that the top-4 sides enjoy.
Consider a top-4 team on the ladder. On average, it wins 1.3125 games per finals series, being:
0.5 week 1 wins (=50%) +
0.25 week 2 wins (=50% x 0.5 week 1 losses, noting week 1 losers survive) +
0.375 week 3 wins (=50% x 0.75 week 1 + week 2 wins ) +
0.1875 week 4 wins (=50% x 0.375 Week 3 wins)
Now consider a lower-4 team on the ladder. On average, it wins 0.9375 games per finals series, being:
0.5 week 1 wins (=50%) +
0.25 week 2 wins (=50% x 0.5 week 1 wins) +
0.125 week 3 wins (=50% x 0.25 week 2 wins) +
0.0625 week 4 wins (=50% x 0.125 week 3 wins)
(Check: total wins = 1.3125 + 0.9375 = 2.25 for two teams. For eight teams: 4 x 2.25 = 9, as expected with 9 games per finals series).
Ratio of wins: top-4 team to a lower-4 team = 1.3125 / 0.9375 = 1.40
That is, a top-4 side can expect to win 1.40 times more than a lower-4 side. This reflects the structural advantage the finals system affords the top-4 teams. When external factors other than the finals structure are considered, winning probabilities other than 50% would exist, and the advantage would be expected to widen.
Tony Dillon is a freelance writer and former actuary. This article is general information and does not consider the circumstances of any investor.