Part 1: Which political party has produced more government surpluses and deficits?
Much of the media coverage and debate surrounding the federal budget is coloured by political bias, uninformed rhetoric, misinformation and value judgments about whether deficits are inherently good or bad. Here we stick to the facts. While the impacts of fiscal policy on such things as jobs, pensions, debt burdens and the implications for current and future taxpayers make for heated dinner conversations, investors are primarily interested in the impacts on investment markets.
This 3-part series will put the federal budget into perspective and address questions such as:
- How often have governments produced budget surpluses? (Part 1)
- How do Labor and Liberal governments compare when it comes to deficits? (Part 1)
- How do Labor and Liberal governments compare when it comes to running up (or paying off) debt? (Part 2)
- How serious are the current levels of deficit and debt? (Part 2)
- Have government deficits been good or bad for stock markets? (Part 3)
Issues such as whether deficits are good or bad for the country as a whole or what the money is actually spent on (i.e. productive assets or recurrent welfare, etc) are questions for another day.
History of federal government surpluses, deficits and debt
The first chart shows the history of federal government fiscal balances and debt levels since Federation, and it also shows the various governments in power. Labor governments are shown in pink and ‘right-leaning’ governments, mainly Liberal and Liberal Coalitions, in blue.
Chart 1: Federal government deficits and debt since Federation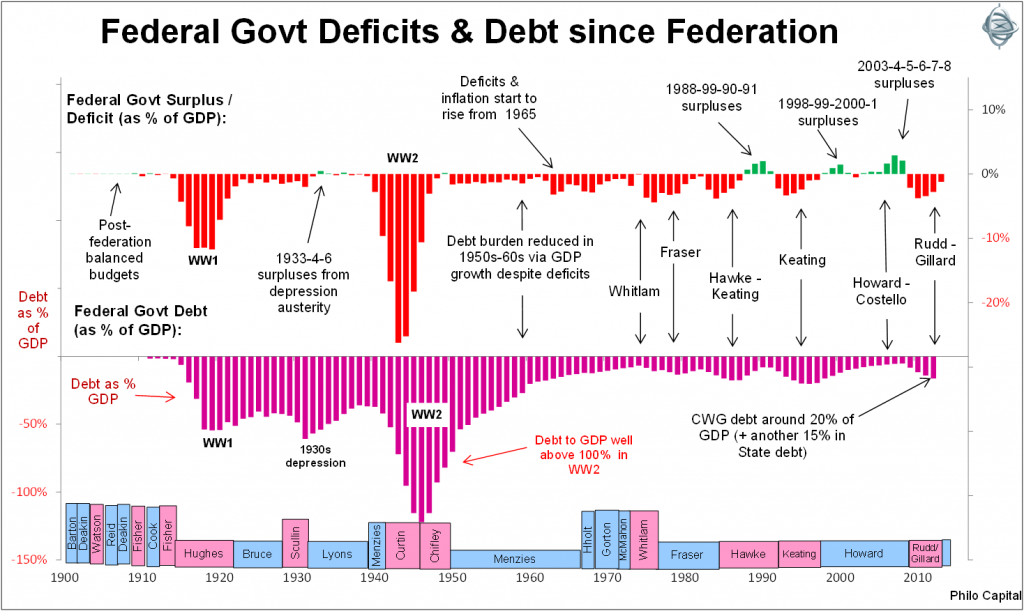
The top section shows the annual government balance (surplus or deficit) expressed as a percentage of GDP, for June years up until June 2013. (Gross Domestic Product, or ‘GDP’ is a common measure of total national output, production, income and spending). A government surplus or deficit in a given year is the total amount of government revenues collected (mostly through taxation) minus total government outlays.
Most of the media attention each year is centred on the budget speech in May of each year (was August in the early years) for the following fiscal (June) year. The budget speech is a statement of policy and intent, but budget measures announced are often amended or modified during the year. What we are concerned about here is the actual outcome each year. That is not just talk or policy or politics, it is fact.
We can see that federal governments have run surpluses (green bars in the top section of the above chart) in only a very small number of years since Federation.
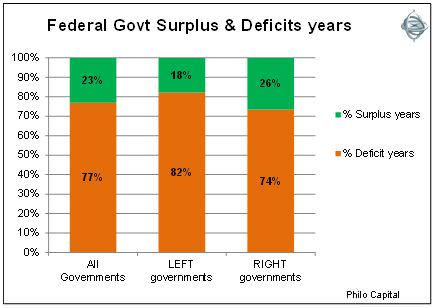
Chart 2 shows that Labor governments have achieved government surpluses in just 18% of all years they were in power, while right-leaning governments have done marginally better, with surpluses in 26% of years in power.
Chart 2: Surplus/Deficit years
Surplus years are rare
Surplus years have been few and far between. Aside from the early years of balanced budgets (before Canberra existed!), the only surplus budget outcomes have been in the following years:
- 1933, 1934 and 1936 resulting from the depression austerity plan under Joe Lyons (UAP). Deficit spending to stimulate the economy was not an option because foreign credit markets refused to lend to Australian governments following the default and restructure on the entire stock of domestically held government bonds in 1931. The government had no option but to balance the budget by imposing austerity measures including savage cuts to wages and spending
- 1949 (just) under Chifley (Labor)
- 1988, 1989, 1990 and 1991 under Hawke/Keating, in the late 1980s boom prior to the deficit spending in the 1990-1991 recession
- 1998, 1999, 2000 and 2001 under Howard/Costello, in the ‘dot-com’ boom prior to the impact of the ‘tech wreck’ slowdown
- 2003 through to 2008 under Howard/Costello (although Labor under Kevin Rudd won the election during the 2008 fiscal year), in the 2000s mining/credit boom prior to the ‘global financial crisis’.
Chart 3 shows Labor budget balances have been worse on average than Liberal/right governments (ie deficits under Labor governments have been double the size of deficits under Liberal/right governments).
Chart 3: Median government balance since federation (as percentage of GDP)
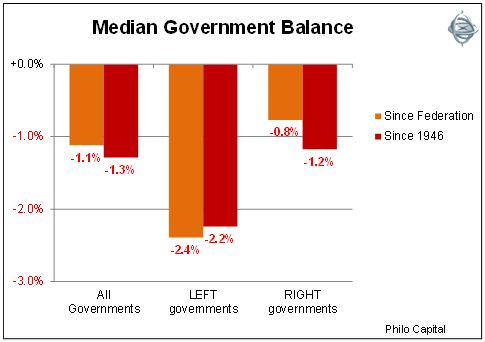
Even if we just look at the post-war era the differences are still significant, and reflect the philosophical differences between the major parties on the role of government in society and in the economy.
Changes in government fiscal balance
More important than the actual level of government fiscal balance from year to year is the change in the balance. This is the case for a couple of reasons. The first is that every government inherits the budget position from the prior government and so the incumbent government has more control over changes in government spending and revenues than it has over the levels of spending and revenues.
The second reason is the change in balance rather than the level reflects the incumbent government’s fiscal stance and its effects on the economy. For example if a government goes from a deficit of $50 billion in one year (as it will in 2013-14) to a deficit of ‘only’ $30 billion in the next year (as is forecast in 2014-15), the $20 billion in lower spending and/or higher taxes in the second year represents a substantial tightening of fiscal policy even though the deficit in the second year appears expansionary if viewed in isolation.
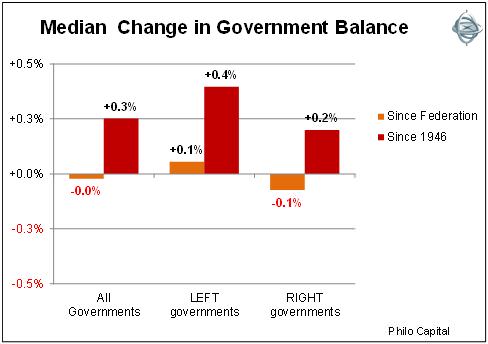
Chart 4 shows that Labor governments have a slightly better record of reducing deficits over the whole period since Federation and also in the post-war period, although in the majority of cases it was reducing their own deficits, since Labor governments also ran significantly larger deficits than Liberal governments.
Chart 4: Median change in government balance (as percentage of GDP)
Some conclusions
Some conclusions include:
- Apart from the golden era before Canberra existed, and in the 1930s depression when Australian governments were excluded from foreign debt markets (and therefore unable to run deficits) following the default, government surpluses have been very rare.
- The surpluses occurred in unsustainable economic booms – the late 1980s credit-driven ‘entrepreneurial’ boom, the late 1990s ‘dot-com’ boom, and the 2000s credit and mining boom.
- Australia’s unusually high levels of population growth, economic growth, favourable demographics and broadening tax revenue base are conducive to central governments running modest on-going deficits, as long as the deficits are used to invest primarily in productive assets rather than recurrent spending and welfare. To date this has tended to be the case in Australia.
- The string of government deficits during Labor’s most recent period in office was not unusual compared to prior Labor or Liberal/right-leaning governments.
- Labor governments have run fewer surpluses and larger deficits (expressed as per cent of GDP) compared to Liberal/right-leaning governments.
- In the post-war era, Labor has produced four surplus years compared to the Liberals’ eleven. In the pre-war era, the big debt build-ups in WW1 and WW2 were bi-partisan, but the 1930s surpluses were the result of partisan austerity measures of the Lyons UAP governments (forerunner to Liberal Party).
- The pre-WW1 period was a golden fiscal era of balanced budgets and no Canberra!
In Part 2, we will look at the record of Labor versus Liberal governments in running up (or reducing) government debt levels. Then in Part 3, we will examine the impact of government deficits and surpluses on stock market returns, under Labor and Liberal governments.
Ashley Owen is Joint CEO of Philo Capital Advisers and a director and adviser to the Third Link Growth Fund.