It is election season in Australia and I have received the usual questions about which side is better for shareholders.
We have been blessed (or cursed) with 30 Prime Ministers in the 118 years since Federation in 1901, an average of 3.9 years each. If we exclude the temporary ‘fill-in’ periods of Watson, Page, Fadden, Forde and McEwen, this leaves 25 PMs in 118 years for an average of 4.7 years each. This is almost exactly the same as the US, which has had 45 Presidents (including one twice) in 230 years, an average of five years per President.
Left or right?
For this article, I have labelled each PM and their government as either ‘left-leaning’ or ‘right-leaning’ to enable comparisons, with ‘right’ for Liberal and Country/National parties, and ‘left’ for Labor.
Traditionally, ‘left’ meant pro-workers, and ‘right’ meant pro-business but is not that straight-forward. For example, in many ways, the Hawke and Keating Labor Governments were more right-leaning than the Fraser Liberal Government. There is a degree of subjectivity involved here but it is a good starting point.
On this basis, we have had right-leaning governments for two-thirds of the time and left-leaning governments for the remaining one-third.
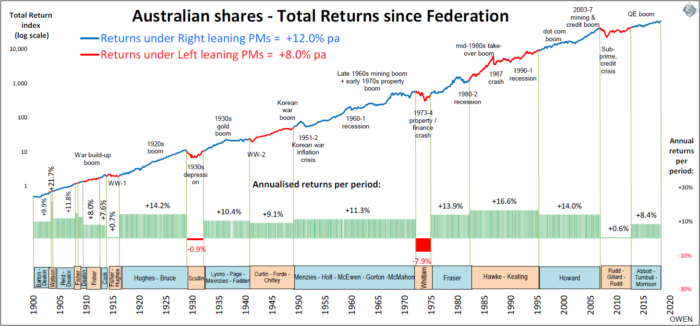
The chart shows total returns from Australian shares since Federation, divided into ‘right’ periods (blue line) and ‘left’ periods (red line). The average annual total returns (including dividends reinvested) for each period are shown in the lower section.
Returns
Right-leaning governments win but due mainly to luck. Total returns from the local stock market have averaged 10.5% per year since Federation, with 12% p.a. on average under right-leaning governments beating 8% p.a. average returns under left-leaning governments.
Click to enlarge
Although the ‘right’ side has clearly won, we can draw no conclusions from this. There are two main problems: causation and luck.
Periods of poor returns
There were only four PMs who presided over periods of very poor or negative total returns from the share market, and they were all left-leaning – Fisher, Scullin, Whitlam and Rudd/Gillard/Rudd. They would all claim that this was not of their making of course. Each would argue that the losses or poor returns were due to the excesses of the prior government, or to global crises beyond their control. They would largely be correct.
First - Andrew Fisher can hardly be blamed for the world-wide stock market falls on the outbreak of the First World War.
Second - Jim Scullin took office just six days before Wall Street’s Black Monday on 28 October 1929, after the long 1920s boom under Stanley Bruce. While he can hardly be blamed for the crash, Scullin made things considerably worse with his ‘Scullin Tariff’ and with the hardline Niemeyer plan and Premier’s Plan to cut spending savagely.
Third – Gough Whitlam came to power on a wave of euphoria after the long period of Liberal rule under Menzies, Holt, Gorton and McMahon. In the brief but volatile Whitlam years, the share market headed straight down with very little respite. The share market collapse in 1973-74 was made worse by Whitlam’s credit squeeze and government financing scandals but the mid-1970s was a period of great turmoil across the world. Governments in many countries fell to military coups, insurrections and widespread civil unrest.
Fourth - Kevin Rudd came to power in November 2007 at the top of the 2003-07 boom that had been frothing along under Howard’s rein. Despite the massive government stimulus programmes during the sub-prime crisis (the second largest in the world relative to GDP, after China), the local stock market collapsed by more than nearly every other country in the world. Prior to Rudd, we had not only a wild credit boom like they rest of the world, we also had a wild speculative mining boom at the same time, thanks to China’s explosive growth. Our boom was bigger than the US and other countries, so our bust was also bound to be bigger.
Periods of high returns
Periods of high returns from shares can often be attributed to rebounds out of recessions, which coincided with the election of new governments. The returns under Joe Lyons from the bottom of the 1930s depression were more a case of recovering over-sold shares in the depression, and the general deflation (which increases real returns), plus the gold boom triggered by the Roosevelt’s US devaluation.
The overall winner for high returns was the Hawke-Keating period, with annualised returns averaging 16.6%. These returns were not only a strong rebound from the early 1980s double-dip recessions under Fraser, but also were greatly assisted by the wide-ranging deregulation and economic reforms introduced by Hawke and Keating.
On the other hand, periods of strong economic growth and stable political regimes do not necessarily result in above-average share returns. For example, the great ‘long boom’ under Menzies in the 1950s and 1960s saw rapid rises in population, living standards, education levels, healthcare, consumer spending, building activity, industrial production and retail sales – but it produced below average returns to shareholders, apart from the brief speculative mining boom at the end of the 1960s which collapsed in the early 1970s.
Cause and effect
Although global events and trends dominate the direction of the local capital markets and economic conditions, global trends do not translate automatically to local impacts. Much depends on the actions of government within each country.
For example, Australia and Argentina had similar economies before the start of the 20th century, and both shared the highest living standards in the world at that time as commodities-exporting former European colonies. However, we have followed different paths since then due largely to the actions and effectiveness (or lack thereof) of governments within each country. Argentina suffered a string of political and economic disasters almost entirely due to internal decisions.
Credit where it's due
Many governments end in economic disaster, so we should give credit to our governments over the years for not falling into the many traps that have ensnared the majority of counties in the world. There are 240 countries in the world today, but Australia is one of the few that is an open democracy with stable, accountable government and strong public institutions. Only Australia, New Zealand, Canada and the US have delivered an unbroken run of high returns to shareholders since 1900 (aside from the inevitable ups and downs along the way).
The credit for this must go to the governments we elect, and to prior governments that established and developed these institutions. Once these big-picture political and institutional settings are in place, it is very difficult to attribute economic outcomes to particular governments or to claim that one side of politics delivered better returns than the other.
Ashley Owen is Chief Investment Officer at advisory firm Stanford Brown and The Lunar Group. He is also a Director of Third Link Investment Managers, a fund that supports Australian charities. This article is for general information purposes only and does not consider the circumstances of any individual.