Equity markets were generally chugging along quite nicely until November when news broke that a new Covid-19 variant, Omicron, had started spreading outside South Africa, grabbing global headlines and sparking fears of a new round of economy- and company-damaging restrictions.
Then on the last day of the month, US Federal Reserve Chair Powell threatened to become the ‘Grinch who stole Christmas’. He abruptly changed his tune on inflation. Powell announced he would retire the word ‘transitory’ – the word he’d been using to quash concerns about a possible sustained surge in inflation. Powell’s about-face was a hawkish signal that the monetary punchbowl that has turbocharged markets might be drained faster than expected. As a result, most equity indices fell between 0% to 4% over November.
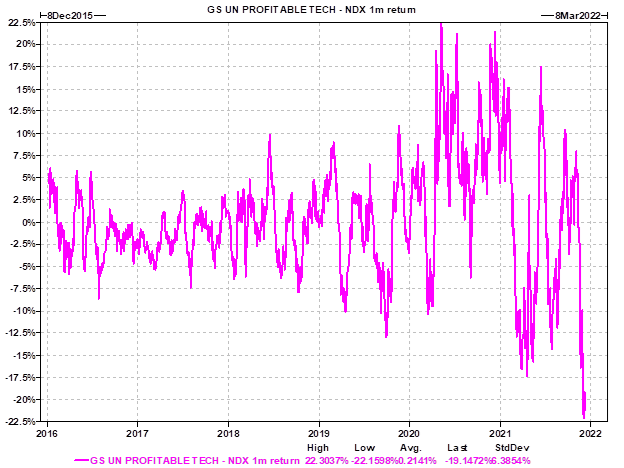
Non-profit techs fare worst
One section of the market, ‘non-profitable’ tech companies, has been particularly severely affected. These companies entered a veritable bloodbath, slumping -13.4% for the month and taking falls from their November highs to a bear-market sized -25%.
Non-profitable tech bear market
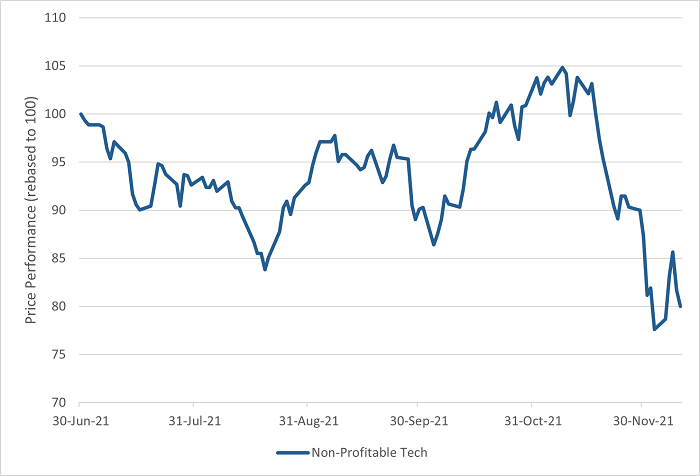
Source: Bloomberg, Goldman Sachs Non-Profitable Tech Index
We explore the impact of Omicron, although by early December, investors were becoming more sanguine about the variant’s impact and reecouping some losses.
Omicron – different, different, but same?
Late November and December usually have little stock-specific news. The last quarterly or six-monthly results are out of the way and investors are waiting for the next earnings results in late January and February the following year. Late in the calendar year markets are often driven by macro factors like inflation, unemployment, GDP growth and geopolitics.
Omicron is the ‘X-factor’ driving markets late this year, and experts are worried this new strain could send the COVID fight back to square one.
The excellent chart below from Nextstrain.org shows just how different Omicron is to previous variants, including Delta. It details the number of mutations to the spike protein (S1) that different variants have undergone. Omicron is in red and the most recent Delta variant in green. Different indeed!
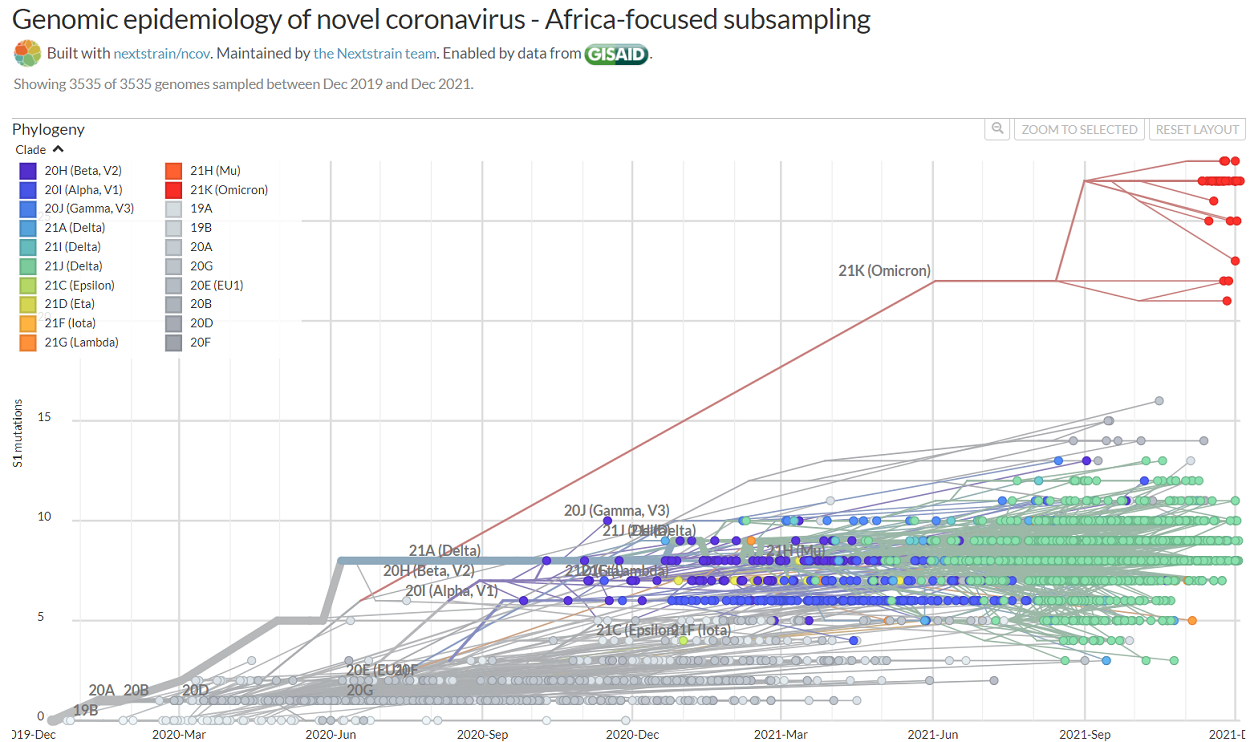
Source: Nextstrain.org
But the growing consensus is that while Omicron may potentially be more transmissible than Delta, it may not be as severe. Early evidence also suggests that whilst existing vaccines may provide less protection against Omicron, they still guard against severe disease and booster shots may help re-establish previous protection levels.
As you can see in the chart below, the recent rise in cases in South Africa has not been accompanied by a rise in deaths as was seen in previous waves.
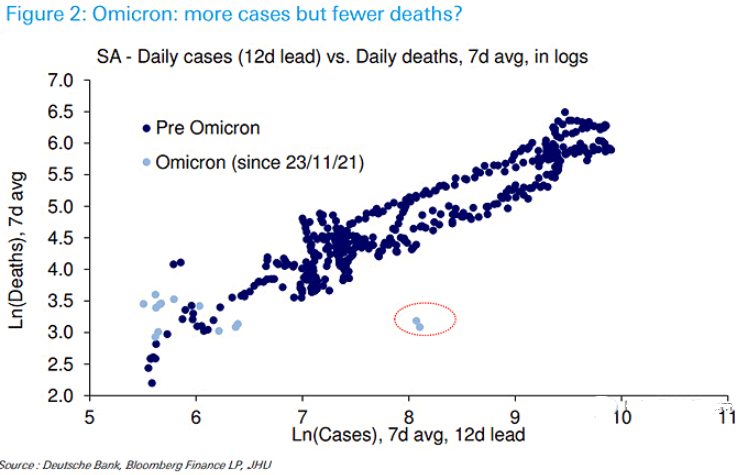
It is too early to be definitive, though. Omicron cases in South Africa have been disproportionately in the young and in a population with higher vaccines levels than in the past, which makes historical comparisons tricky.
Markets hate uncertainty and news on this new variant will dominate markets moves until there is greater clarity across three key areas:
- Its transmissibility
- Its virulence
- The effectiveness of current and future vaccines
For equity investors, the impact of the virus on company valuations is often most directly felt through the effect of mobility restrictions on demand for companies’ goods and services. Governments will be loath to reintroduce more restrictions given what countries have already been through. However, if Omicron threatens to overwhelm health care systems investors need to be prepared for fresh measures. Some countries have already slapped restrictions on travel.
We manage the Ophir funds so that companies in our portfolio are impacted as little as possible by virus outcomes. Examples of these businesses for our Australian equity funds includes:
- Elders – the rural services business involved in the sale of wool, grain, seed, fertilizer and animal health products.
- EBOS – the medical consumables and equipment company that supplies goods to hospital and pharmacies.
- NextDC – Australia’s leading independant data centre operator that benefits as businesses move to the cloud.


Given our lack of PhD’s in virology, we are unlikely to get an ‘edge’ on the market by pricing Omicron outcomes. We remain content to maintain our edge from the bottom-up work we do in meeting with company management and others (customers, suppliers, competitors, etc) in the eco-system in which they operate.
Inflation (and rate rises) – a Scrooge-like shadow
The other main risk garnering attention for equity markets in 2021 is inflation, which is casting a Scrooge-like shadow over Christmas.
COVID and inflation are linked at the hip, with the former in large part causing the latter. Today’s current multi-decade-high consumer price inflation levels in some major developed economies has been caused by two main influences:
First, huge fiscal stimulus by governments in response to COVID. When combined with mobility restrictions, this pent-up demand has been disproportionately spent on goods, while supply chains simply haven’t had the capacity to keep up with that demand.
Second, labour supply has taken a knock because COVID has forced some workers permanently out of the workforce and others are unwilling to come back to work yet due to virus-related health concerns.
Inflation has persisted longer than most economists predicted, including central bankers whose job it is to tame it, so many now expect the removal of rock-bottom emergency-level interest rates to be brought forward.
Earlier this year, most expected US interest rates to begin increasing only at the start of 2024. Now the consensus is steadily moving towards rates lifting off in 2022. Below we show the US government debt ‘yield curve’, or the rate of interest for lending money to the US Government for different time periods from 1 month up to 10 years. These rates have been consistently moving higher recently, particularly for short periods like the next 2-3 years.
US Government yield curve
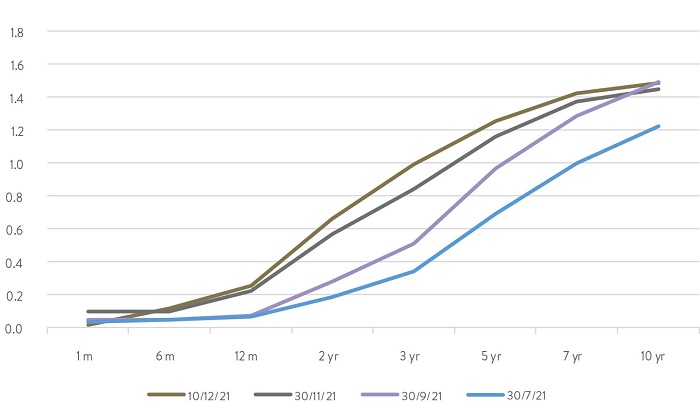
Source: Bloomberg
Bear market bloodbath and the ‘expensive small growth’ implosion
This has created headwinds for domestically-orientated small-cap growth businesses in the US, especially ‘non-profitable tech’ companies. These up-and-coming technology-based businesses are not making profits yet or are deliberately suppressing profits to reinvest for future growth.
Some examples of more well-known names to be hit hard include, with their share price falls from their 52 weeks highs in brackets: Draft Kings (-61.2%), Pinterest (-59.9%), Lyft (-43.7%), Robinhood (-76.8%), and Docusign (-55.6%).


In the chart below of US small-cap growth (as proxied by the Russell 2000 Growth index in the yellow line), and non-profitable tech businesses (dark blue line), you can see steep falls over the last month or so as bond yields (red line) have continued to move higher.
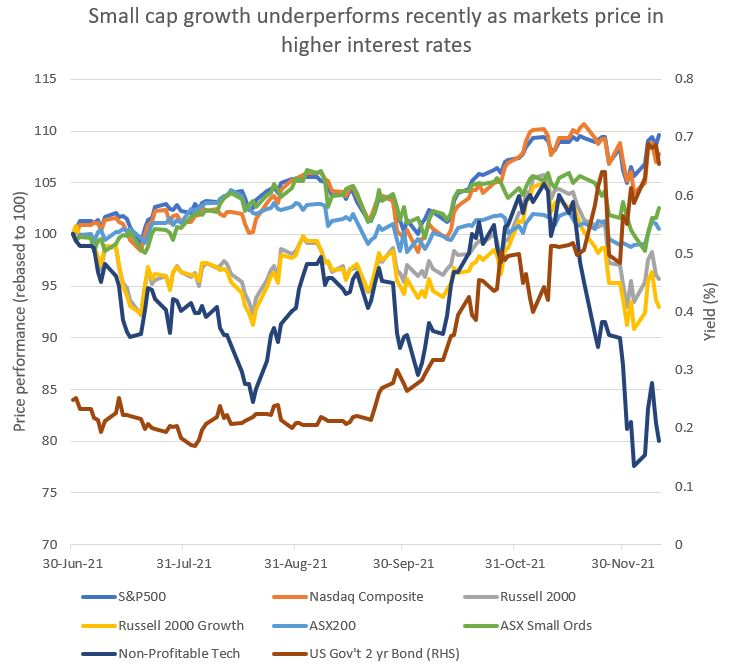
Source: Bloomberg
Higher interest rates disproportionately negatively impact the valuation of businesses with the most profit growth out further into the future, and this tends to be the smaller and less profitable businesses.
The median valuation of non-profitable tech stocks has almost halved (!) from a peak this cycle of 10x Enterprise Value/Sales in March this year, to 5.6x today.
Some of our most growth-orientated and high valuation companies in our Global Opportunities Fund have had their valuations de-rate substantially – hurting performance – whilst underlying company fundamentals such as revenue growth, in general, continues to be strong and beat consensus.
The key question for us is whether there is much further to go in the valuation pull-back for the ‘growthiest’ parts of the global market, particularly the US small-cap market? The good news is that the underperformance of non-profitable tech versus Big Tech (Nasdaq) has been historically extreme recently, with the biggest gap seen in years (chart below).
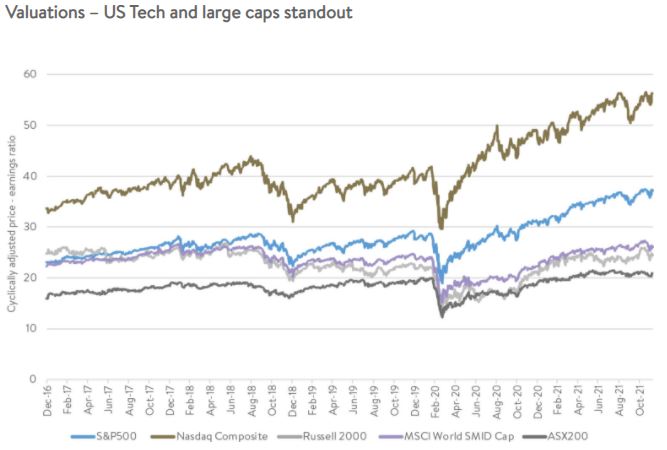
Valuations in our global pond still looking ok
The reality is there is no one ‘market’, just a collection of individual companies in which we can invest. That said, the two most ‘expensive’ parts of the markets are the two pools we don’t invest in – US large caps and US Big Tech.
In the chart below, you can see that the long-term average (cyclically adjusted) price-earnings ratios of the S&P500 and the Nasdaq are well above their pre-COVID levels. Global small-mid caps (MSCI World SMID Cap), US small caps (Russell 2000) and the Australian share market (ASX200) valuations don’t look anywhere near as worrisome.
Difficulty anticipating corrections
The uncertainty of Omicron and more recent heightened volatility can no doubt create some unease for investors. For those perpetually worried about market falls and trying to time them, the wise words of famed investor Peter Lynch often come to our minds:
“Far more money has been lost by investors preparing for corrections, or trying to anticipate corrections, than has been lost in corrections themselves.”
Andrew Mitchell and Steven Ng are co-founders and Senior Portfolio Managers at Ophir Asset Management, a sponsor of Firstlinks. This article is general information and does not consider the circumstances of any investor.
Read more articles and papers from Ophir here.