A year ago in Cuffelinks, we wrote about the bubble in stocks (and inevitably property) inflated by the baby boomer’s desperate search for yield. We described the pursuit of yield as a fad. We were not surprised to watch investors rushing into higher yielding banks and Telstra but we were shocked to hear of investors buying BHP for its ‘progressive’ dividend.
The bubble has burst but the fad lives on, and banks have wiped billions from retirees’ wealth while BHP has backed away from its ‘progressive’ dividend position. We wrote:
“The pursuit of yields through dividend-paying shares is analogous to a mindless heard of bison stampeding towards a cliff. Wall Street will sell what Wall Street can sell. Right now selling yield and income is the easiest game in town. Investors are predisposed to hearing the siren song of income and advisers and product issuers are rushing to feed the hoards. There are only a few who are willing to question the conventional thinking about pursuing yield at all costs.
My belief is that the pendulum will swing back and this time is no different to other periods of unbridled optimism…”
Of course much has changed. BHP has fallen 35%, CBA declined 26% from its interim peak to trough, NAB 28% and Telstra 23%. What has not changed is retirees’ need for income. But is there a better way to generate income that suffers less from the massive tides associated with mass investor hype and hysteria?
High payouts may generate income but limit growth
I believe there is and some basic arithmetic can demonstrate a superior choice even for those requiring income.
Table 1. High ROE company paying out 100% of earnings
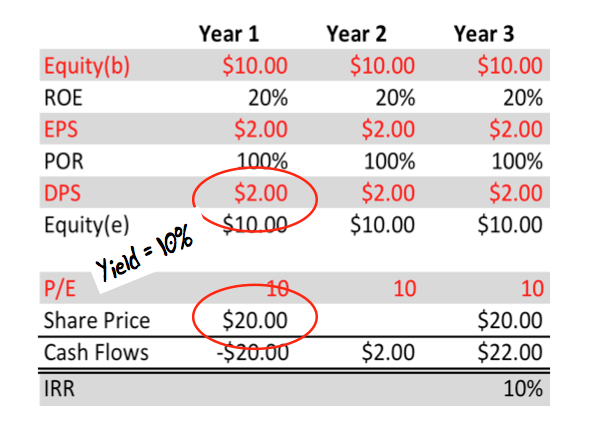
Let’s start with the company described in Table 1 by making some minor assumptions. First, we assume the business is able to generate a return on equity (ROE) of 20% sustainably. Second, we can buy and sell the shares on an unchanged price earnings (P/E) ratio of 10 times. The final assumption is a payout ratio of 100%.
We have assumed no increases in debt (which increases the risks) and no dilutionary share issues. The company’s only source of growing equity is retained profits.
Table 1 demonstrates that an investor who purchases and sells shares in a company with an attractive rate of return on equity, a constant P/E and a payout of 100% will receive as their return an internal rate equivalent to the dividend yield at the time the shares are purchased. This represents the upper bound of their return – the dividend yield is the best outcome, unless they speculate successfully on an expansion of the P/E ratio. For that to occur, sentiment or popularity towards the company’s shares would have to change and be correctly predicted.
In more simple terms, if you chase a high yield and the company pays all of its earnings out as a dividend, the high yield is about all you should expect. Perhaps that is what investors who chased the banks, Telstra and BHP are now finding out.
Lower payout ratios can improve total returns
In Table 2, the only item that has changed is the payout ratio, which is now zero. Of course this has a major impact on everything else.
Table 2. High ROE company paying out 0% of earnings
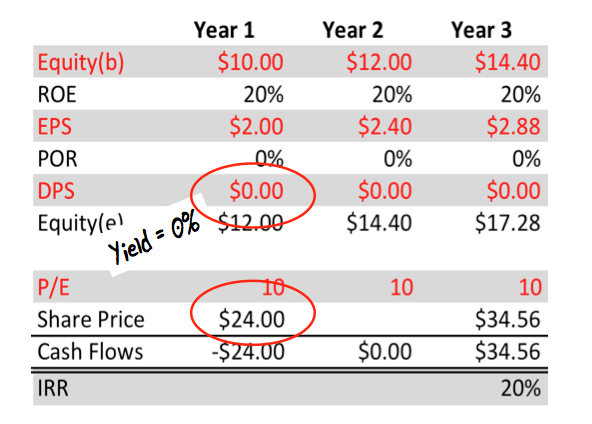
This company pays none of its earnings out as a dividend. An investor who buys and sells the shares on the same P/E ratio will experience capital and earnings growing by the rate of the retained ROE. The constant P/E ratio means the IRR to the investor will equal the return on equity of 20%.
My proposal is that investors who chase higher yields, especially from companies that pay the bulk of their earnings out as dividends, are missing out on major financial benefits. The corollary is that company boards who acquiesce to shareholder demands for higher dividend payout ratios – especially where they are able to employ retained earnings at high rates of return – are ultimately doing their shareholders and their share price a disservice, as shown in Table 3.
Table 3. Power of true blue-chips (not Telstra)
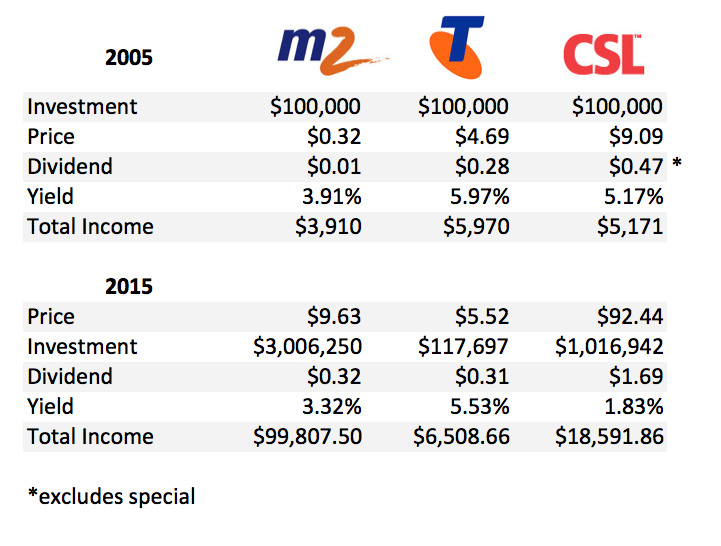
It’s not only about dividend yields
Investors in 2005 who invested $100,000 in the higher, 5.9%-yielding Telstra shares could have invested $100,000 in the M2 Group. The major difference between these two companies was not just their yield. Telstra’s management elected to pay the bulk of the company’s earnings out as a dividend. Indeed, under Solomon Dennis Trujillo, Telstra’s dividend exceeded earnings over a number of years. While Telstra’s payout ratio was near 100%, M2 Group’s payout ratio was much lower. Table 2 revealed the desirable impact on returns from investing in a company that can retain earnings and reinvest those earnings at a high ROE. Table 3 puts that into practice.
Investing $100,000 in Telstra in 2005 for ten years has produced an investment of about $117,000 or an average annual compounded capital return of 1.5% p.a. Many of you will jump to the defence of Telstra and point out that I have excluded the dividends from the calculations. But this article is about retirees who have been chasing income to spend on food and clothing and other essentials like BMWs and annual overseas holidays, so I have not assumed a reinvestment of dividends.
In 2005, the 5.9% yield on Telstra shares equated to $5,900 of fully franked income. Telstra has increased the dividend since then from 28 cents to 30 cents per share and the low increase reflects that fact that profits have not grown markedly. In any event, the income on the $117,000 investment would be about $6,500.
Contrast this with M2 where the ability to generate high returns on large amounts of capital have turned $100,000 into $3 million and importantly for those desperate for income, turned $3,900 of dividends in 2005 into almost $100,000 of fully franked dividends in 2015.
M2 is not an isolated example of the power of high rates of return on equity and the ability to retain profits. For example, CSL also displayed a less attractive dividend yield than Telstra in 2005, but was able to retain capital and compound it at an attractive rate, ultimately producing more wealth and more income.
Investors chasing the highest yielding blue chip shares are missing out on the returns and income available from true blue chips – the type that we prefer to fill our portfolios with. Investors are making an expensive mistake by eschewing those companies with lower yields today but are able to grow their income. Go for growing income, not the highest yield.
Roger Montgomery is CIO at The Montgomery Fund and author of ‘Value.able – how to value the best stocks and buy them for less than they’re worth.’ As a special Cuffelinks offer for Christmas, go to rogermontgomery.com/valueable-book/ for a two-for-one book promotion until December 13th. The coupon code is TWO4ONE. This article is for general information purposes only.