People often refer to themselves as either ‘fundamental’ or ‘technical’ investors and feel so strongly about one style of investing compared to another that they engage in heated debates. We believe investors should use whatever tools are at their disposal to try to beat the market, and that fundamental analysis combined with technical analysis has a greater probability of achieving this than one style alone.
Understanding fundamental analysis
When we refer to fundamental analysis we mean the process of determining accounting profits, operating cash flows, free cash flows, balance sheet debt, cash and overall balance sheet strength, as well as estimating these metrics two years into the future.
There are about 2,250 stocks listed in Australia (2.5% of the world's listed market capitalisation) and in any given year 600 to 700 of these companies actually make a profit - so about 75% of Australia's listed companies do not. We are unable to analyse companies that do not make a profit.
Of the profitable companies, 5% are usually cheap and 5% are really expensive in any given year. This equates to a ‘sweet spot’ of about 70 companies that meet our fundamental criteria. We hope to construct a portfolio of between 30 and 40 core positions in any given year.
This approach is outlined in Diagram 1 below. Importantly, we need an open mandate to implement this investment strategy (that is, few restrictions on the fund's investment style). Investing with an open mandate is unusual in Australia and particularly in the superannuation investment industry, although this is changing. We estimate that around 85% of all super money invested is invested on a restricted mandate, effectively reducing the number of really good opportunities available to a portfolio manager.
Diagram 1. Identifying good and bad stocks from the listed universe
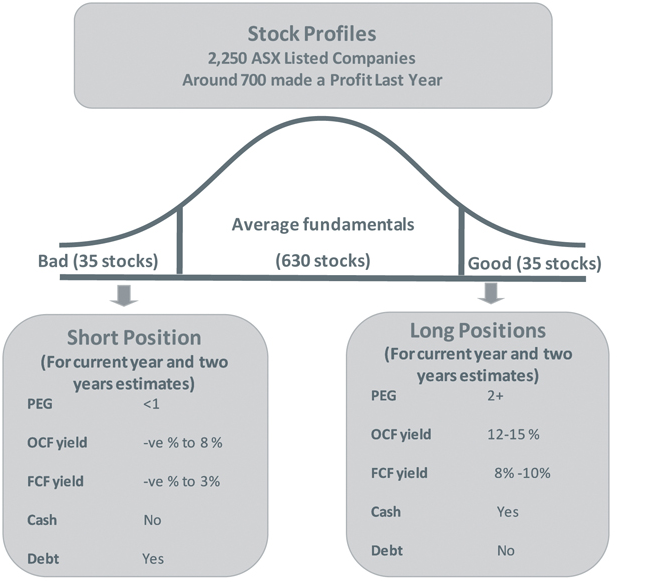
Diagram 1 shows that a typically cheap stock may have:
- earnings growth of around 20% per annum
- price-to-earnings (PE) multiple of around 10 times
- 12-15% operating cash flow (OCF) yield
- 8-10% free cash flow (FCF) yield
- minimal debt on the balance sheet
- (a 'long position' means the fund will buy that stock).
Conversely, an expensive stock may have or be:
- growing at 10% per annum
- trading on a PE multiple of 20 times
- negative to 3% operating cash flow
- negative to 3% free cash flow yield
- lots of debt on the balance sheet
- no cash
- (a 'short position' means the fund will sell that stock).
The process of trying to identify cheap and expensive stocks is ongoing, and just as individual stocks exhibit cyclical earnings and valuations, so too does the overall share market.
At the time of writing, several sectors in the market are showing high valuations, and a smaller, more discrete, group of stocks are presenting as fundamentally cheap. This is often the case.
Using technical analysis
Diagram 2 shows how we buy and sell stocks. No matter how cheap we think a stock is, we are not allowed to buy if it is falling in price or in a downward trend. Conversely, no matter how expensive a stock, we do not sell or short-sell if it is in a price uptrend.
Diagram 2: Do not buy a falling stock, do not sell a rising stock
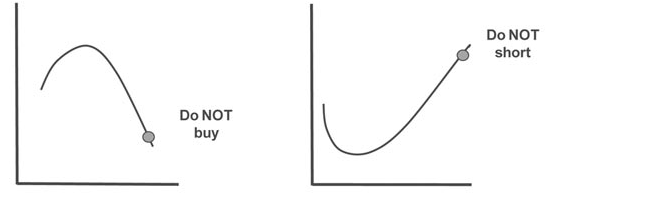
Buying stocks that are falling and selling stocks that are going up are probably the two biggest mistakes that investors make. There are deeply engrained reasons for this and many psychological barriers within investors' psyche that often prevent them from buying stocks that are going up and selling stocks that are going down. In fact, investors are often compelled to do exactly the opposite.
An entry strategy to buy cheap stocks
Diagram 3, below, shows the process that we undertake once it has identified a stock to be cheap. We wait for the falling share price trend to finish (this is how a stock becomes cheap - people sell it). Once the price starts to recover we initiate a 1% (of our portfolio) position. At this point conditions are ideal to generate good risk-adjusted returns. We then add 1% and another 1% as the price rises, up to a maximum of 5% of our portfolio at cost into any one position.
Our core positions start as 1% positions initially so we do not have too much capital invested in any one new idea. Starting with a small position is another way of mitigating risk.
Diagram 3: Staged entry and exit points
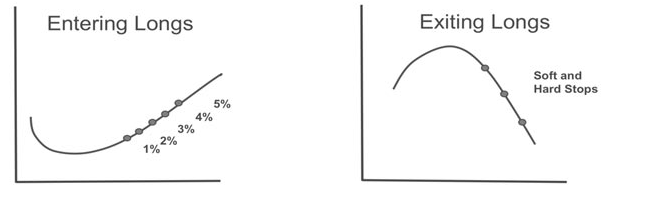
Diagram 3 also shows how we exit our positions once the long-term trend has ended and the stock becomes expensive. We sell a third of the position initially then another third and eventually the final third. In this way we are not making decisions about an entire position on a day-to-day basis.
The fundamental and technical processes in practice
Diagram 4, below, shows the combination of fundamental and technical analysis operating together using Macquarie Group as an example.
Diagram 4: Combining technical and fundamental analysis
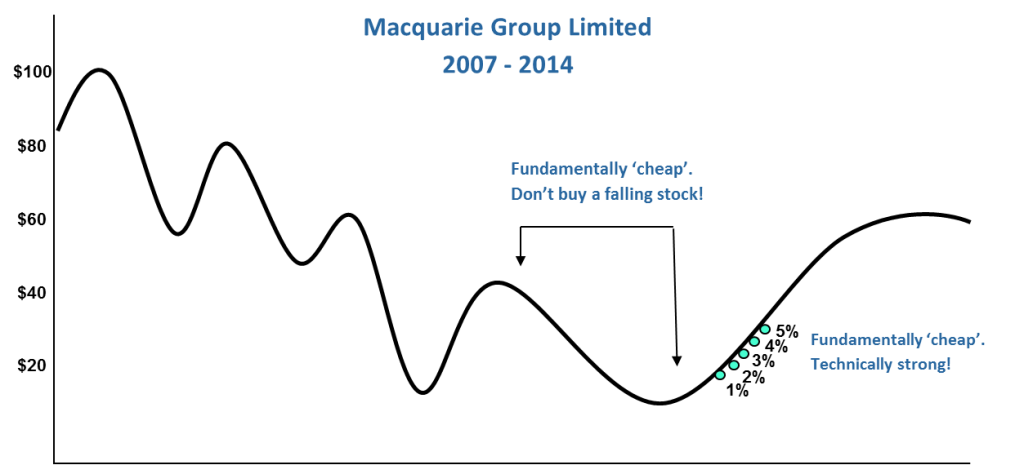
Shortly after reaching a peak of nearly $100 (on our fundamental analysis at the time, reasonably expensive), the GFC brought havoc and Macquarie's earnings fell substantially, along with its share price. It continued falling and at around $40 started to look reasonably cheap from a fundamental perspective. However, as outlined, we don’t buy a stock that is cheap but still falling in price.
Macquarie subsequently traded as low as around $17 and then recovered to its current price of around $57 ($61 if you include the recent spin-off of Sydney Airports). Once the fundamental and technical picture for Macquarie lined up (that is, the stock was fundamentally cheap and technically going up), our approach was to buy with an initial 1% position at $23, then add to it again around $26, $28, $35 and $41, accumulating a 5% position at cost over time.
We believe, in this example, had we started buying when we identified Macquarie as fundamentally cheap when the share price was still falling, we would have been taking unnecessary risk and incurring large losses before the stock price had finished falling and started to rise.
From a fundamental perspective, it does not matter how cheap or expensive investors may think a stock is, should the share price still be falling it is not a good time to buy technically, and should the share price still be rising, it is not a good time to sell technically.
Karl Siegling is Managing Director and a Portfolio Manager at Cadence Capital Limited (ASX: CDM). This article provides general information and does not constitute personal advice.